France vs. Spain Semifinal Prediction: FIFA World Cup Odds, Betting Picks
France is headed to the semifinals for a third straight World Cup as they prepare to face European champions Spain on Tuesday.

American League vs. National League MLB All-Star Game Preview and Prediction
The 96th MLB All-Star Game heads to Citizens Bank Park in Philadelphia on Tuesday night, with the National League serving as the home team in front of what should be an electric Phillies-heavy crowd.

-
Kevin Tompkins
2026 MLB Home Run Derby Rules, Odds, Betting Predictions
The 2026 MLB Home Derby favors prodigious power over endurance, so it really opens up the field tonight.

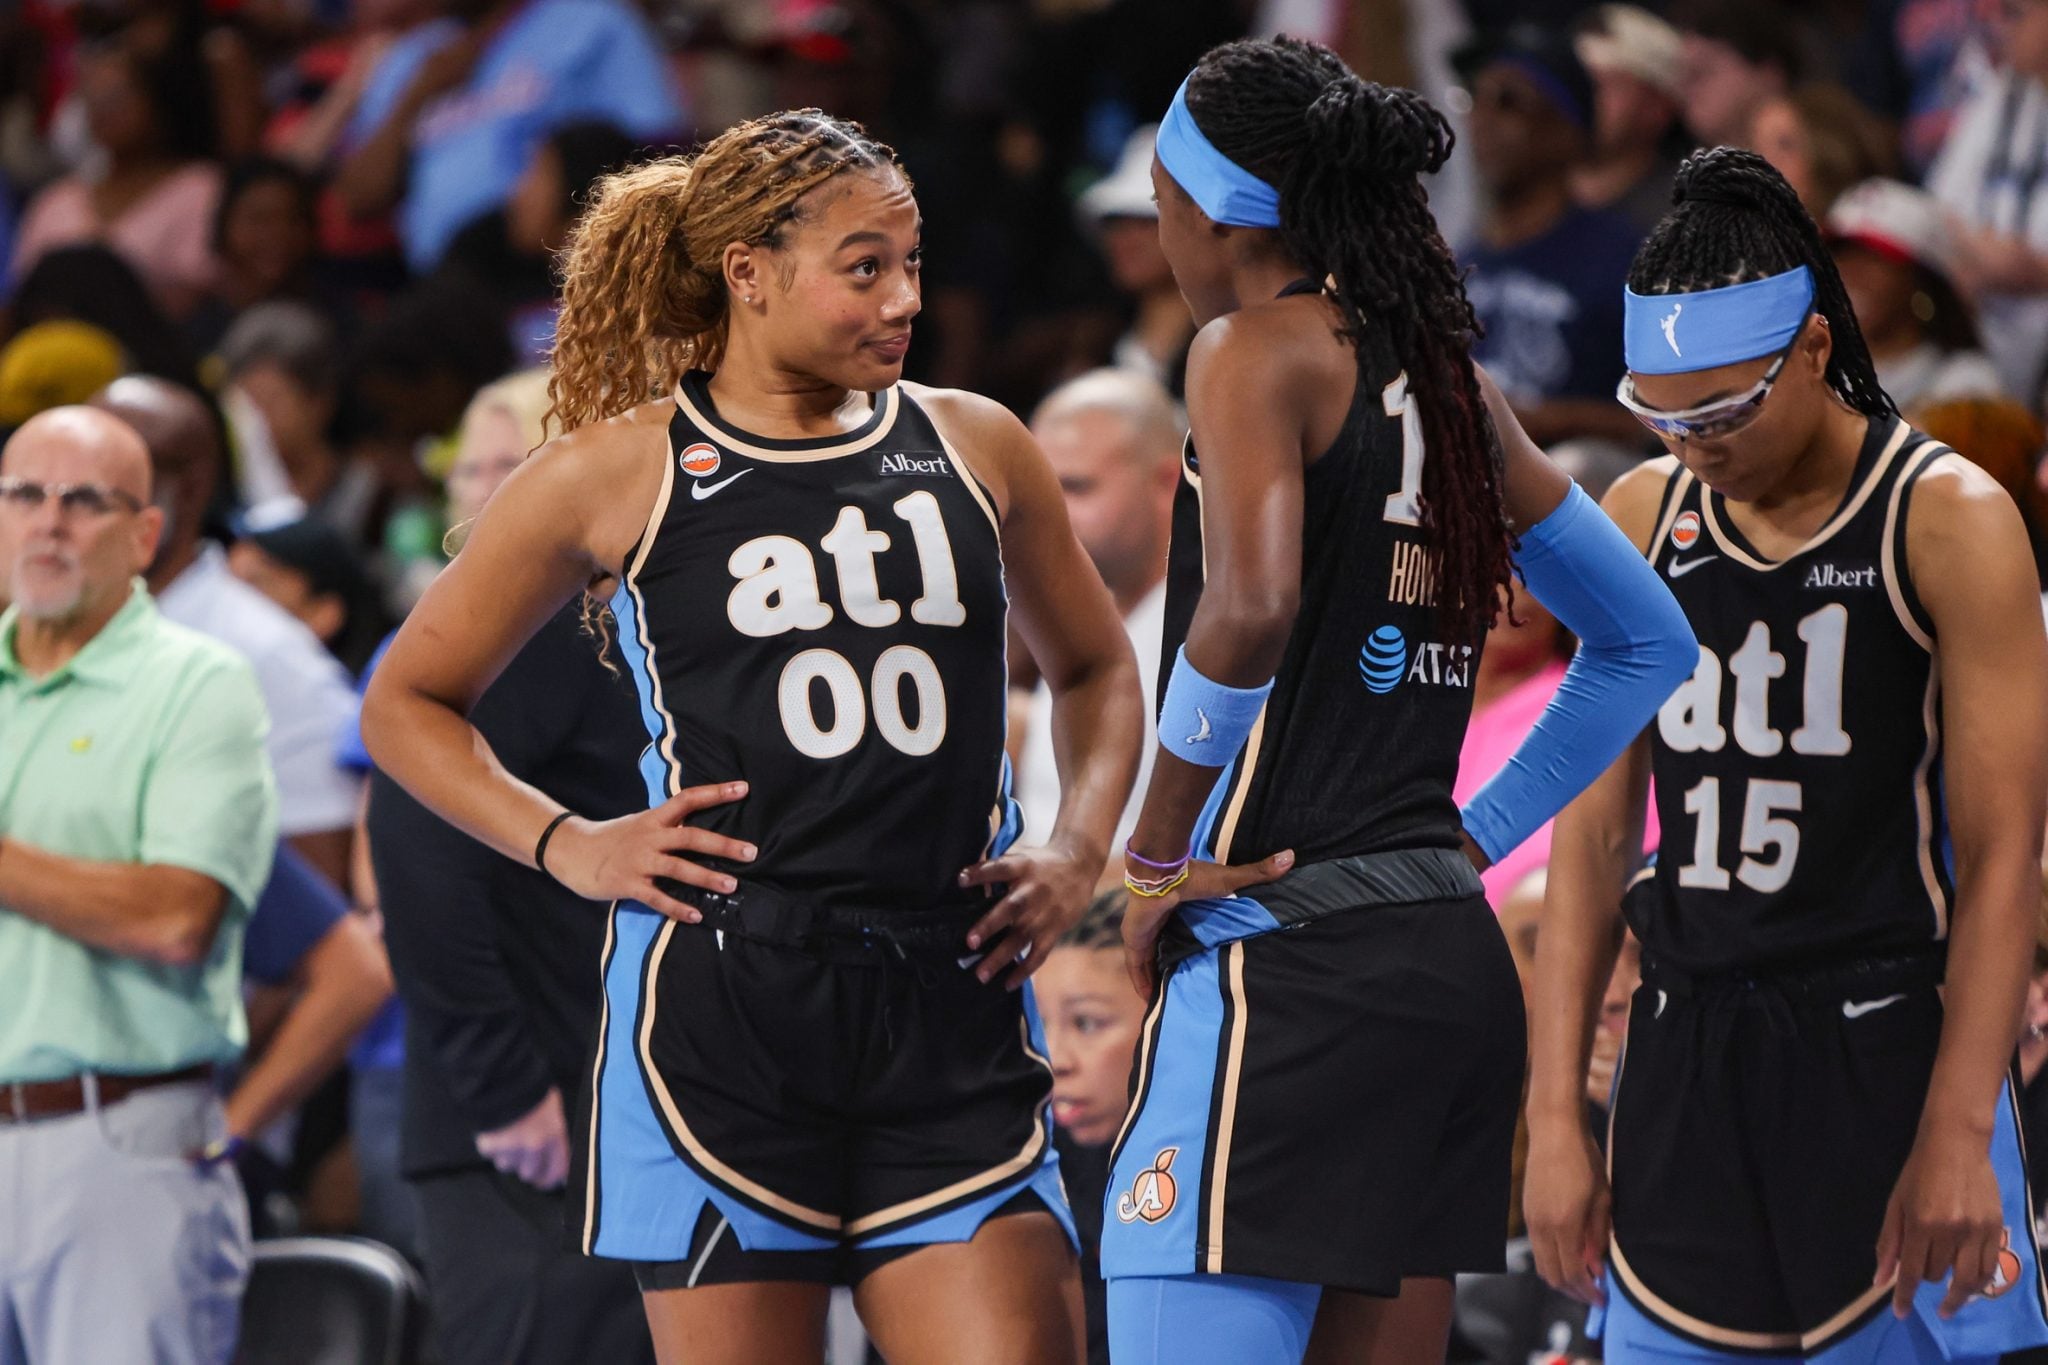
Los Angeles Sparks vs. Atlanta Dream WNBA preview and prediction
The Atlanta Dream look to stop a disturbing slide in the WNBA standings when they host the Los Angeles Sparks Monday at 7 p.m. ET.
2026 Wimbledon men’s singles final preview, prediction: Jannik Sinner vs. Alexander Zverev
It all comes down to No. 1 against No. 2 in the Wimbledon men’s singles final as Jannik Sinner faces Alexander Zverev.

Tiger-Cats vs. Roughriders Prediction: CFL Week 6 Point Spread, Odds
The Saskatchewan Roughriders will look to keep pace at the top of the CFL’s West Division standings when they return home to host the banged up Hamilton Tiger-Cats on Sunday night.

Stampeders vs. Alouettes Prediction: CFL Week 6 Point Spread, Odds
The Alouettes look to extend their lead atop the CFL East and remain undefeated at home when they play host to the surging Stampeders on Saturday at Percival Molson Stadium.

Norway vs. England Quarterfinal Prediction: FIFA World Cup Odds
England’s pursuit of a second World Cup title enters its biggest test yet on Saturday when the Three Lions meet Norway in the quarterfinals at Miami Stadium.

2026 Wimbledon Women’s Singles Final Preview, Prediction: Karolina Muchova vs. Linda Noskova
It will be an all-Czech matchup in the Wimbledon women’s singles final on Saturday afternoon with Karolina Muchova facing Linda Noskova.

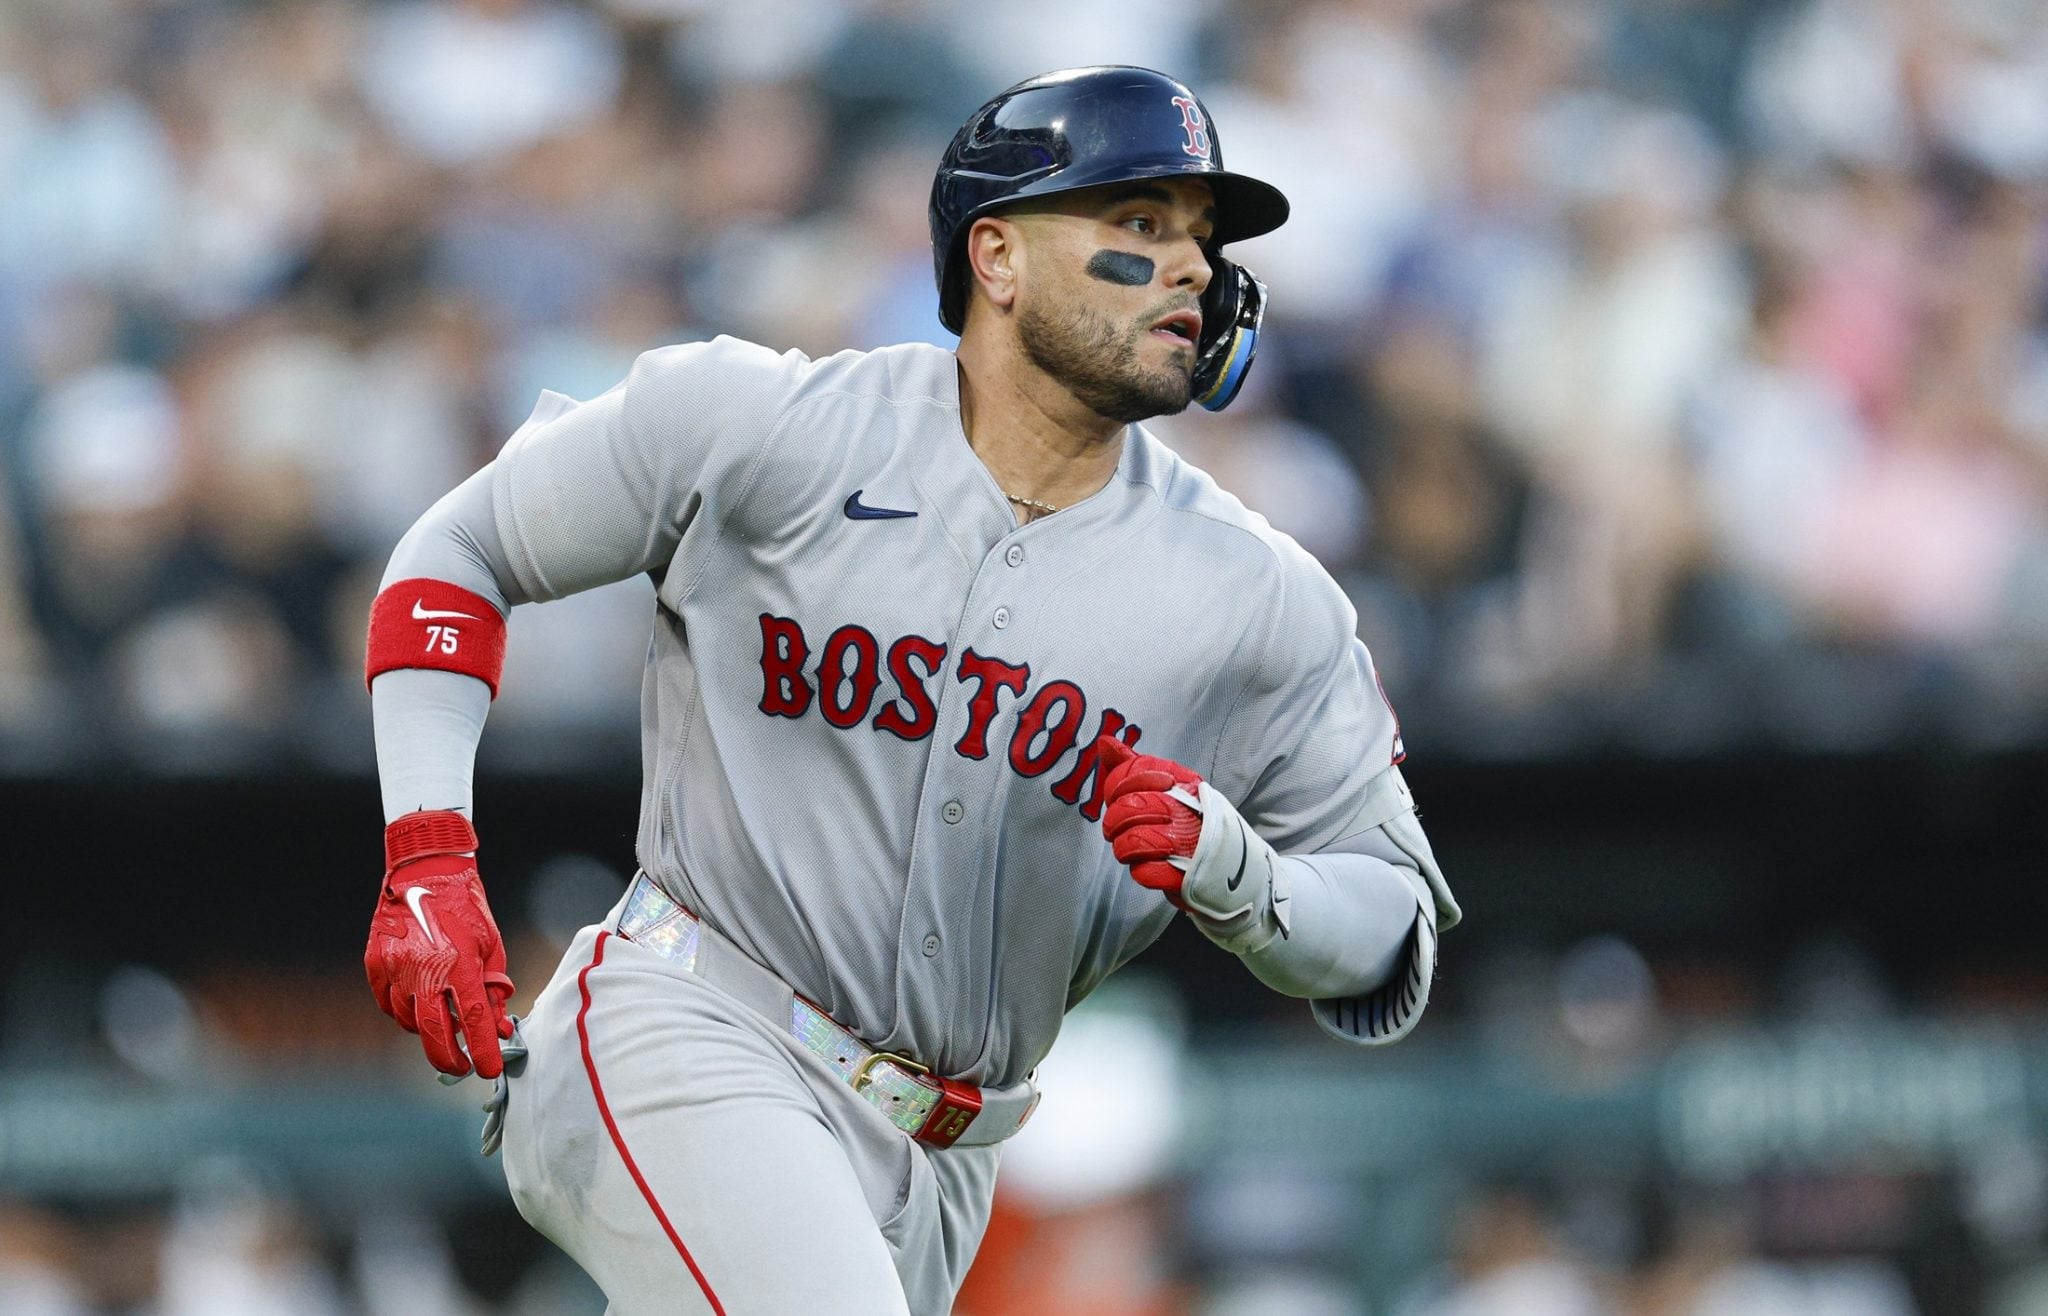
Boston Red Sox vs. New York Mets: Odds, Prediction
A full 15-game MLB slate is scheduled for Friday, which will include an Interleague matchup between the Boston Red Sox and New York Met at 7:15 p.m. ET.
France vs. Spain Semifinal Prediction: FIFA World Cup Odds, Betting Picks
American League vs. National League MLB All-Star Game Preview and Prediction
-
2026 MLB Home Run Derby Rules, Odds, Betting Predictions
Los Angeles Sparks vs. Atlanta Dream WNBA preview and prediction
2026 Wimbledon men’s singles final preview, prediction: Jannik Sinner vs. Alexander Zverev
Tiger-Cats vs. Roughriders Prediction: CFL Week 6 Point Spread, Odds
Stampeders vs. Alouettes Prediction: CFL Week 6 Point Spread, Odds
Norway vs. England Quarterfinal Prediction: FIFA World Cup Odds
2026 Wimbledon Women’s Singles Final Preview, Prediction: Karolina Muchova vs. Linda Noskova
Boston Red Sox vs. New York Mets: Odds, Prediction


