Buffalo Sabres vs. Montreal Canadiens Game 4 Prediction, NHL Odds
The Habs have won back-to-back games in the 2026 postseason for the first time and try for a 3-1 lead over the Sabres in Game 4 of their semifinal series on Tuesday at Bell Centre.

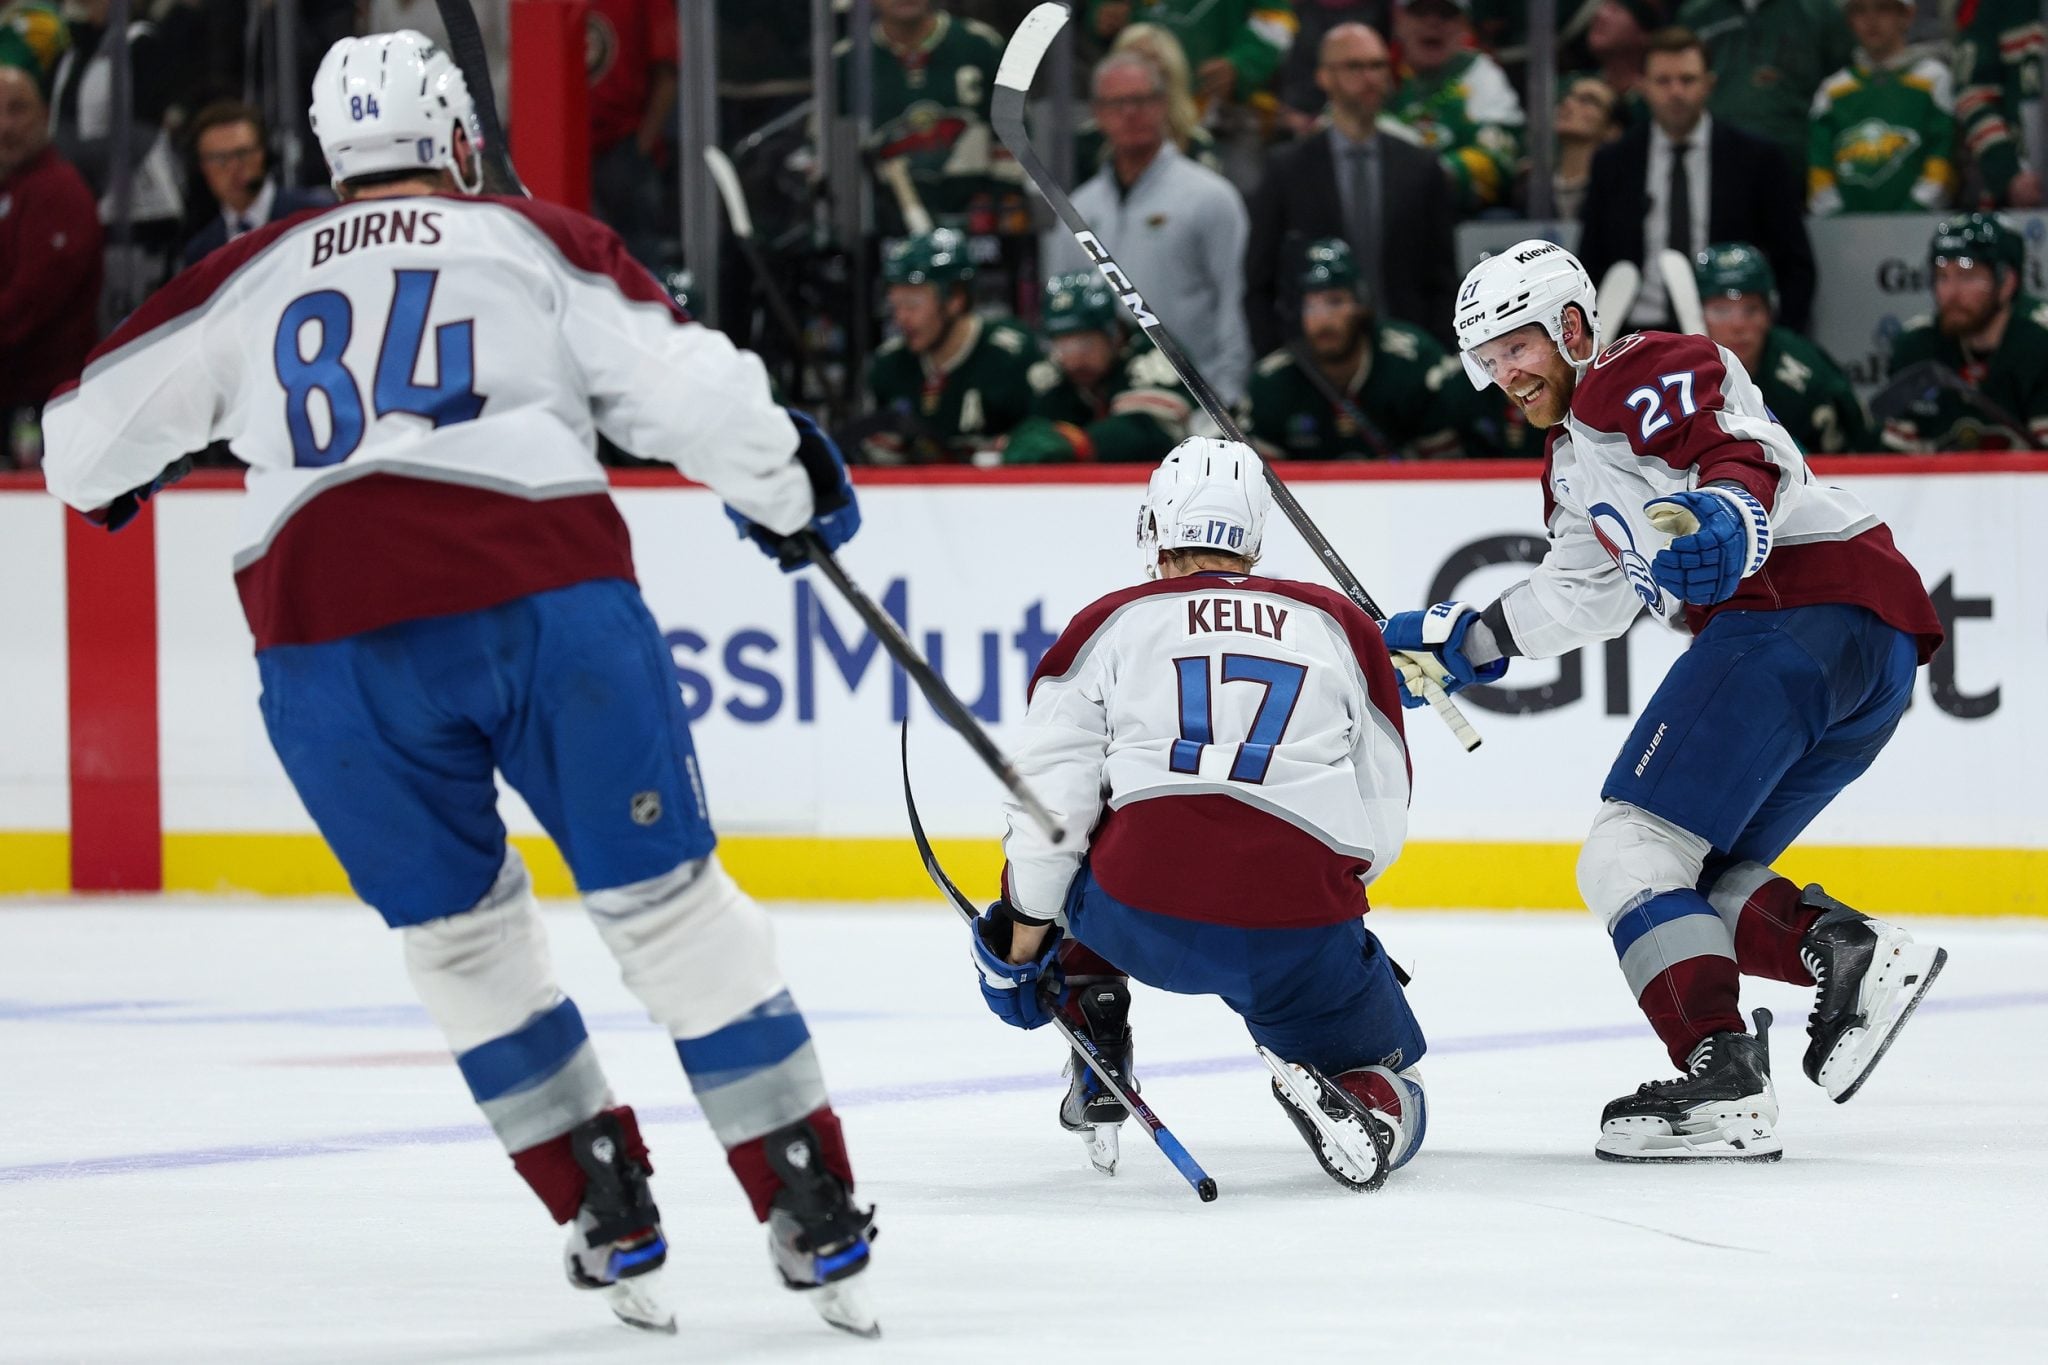
Parker Kelly, Avalanche push Wild to brink with Game 4 win
Parker Kelly scored the go-ahead goal and the Avalanche pulled away for a 5-2 win over the Wild in Game 4 of their Western Conference semifinal series on Monday in Saint Paul, Minn.
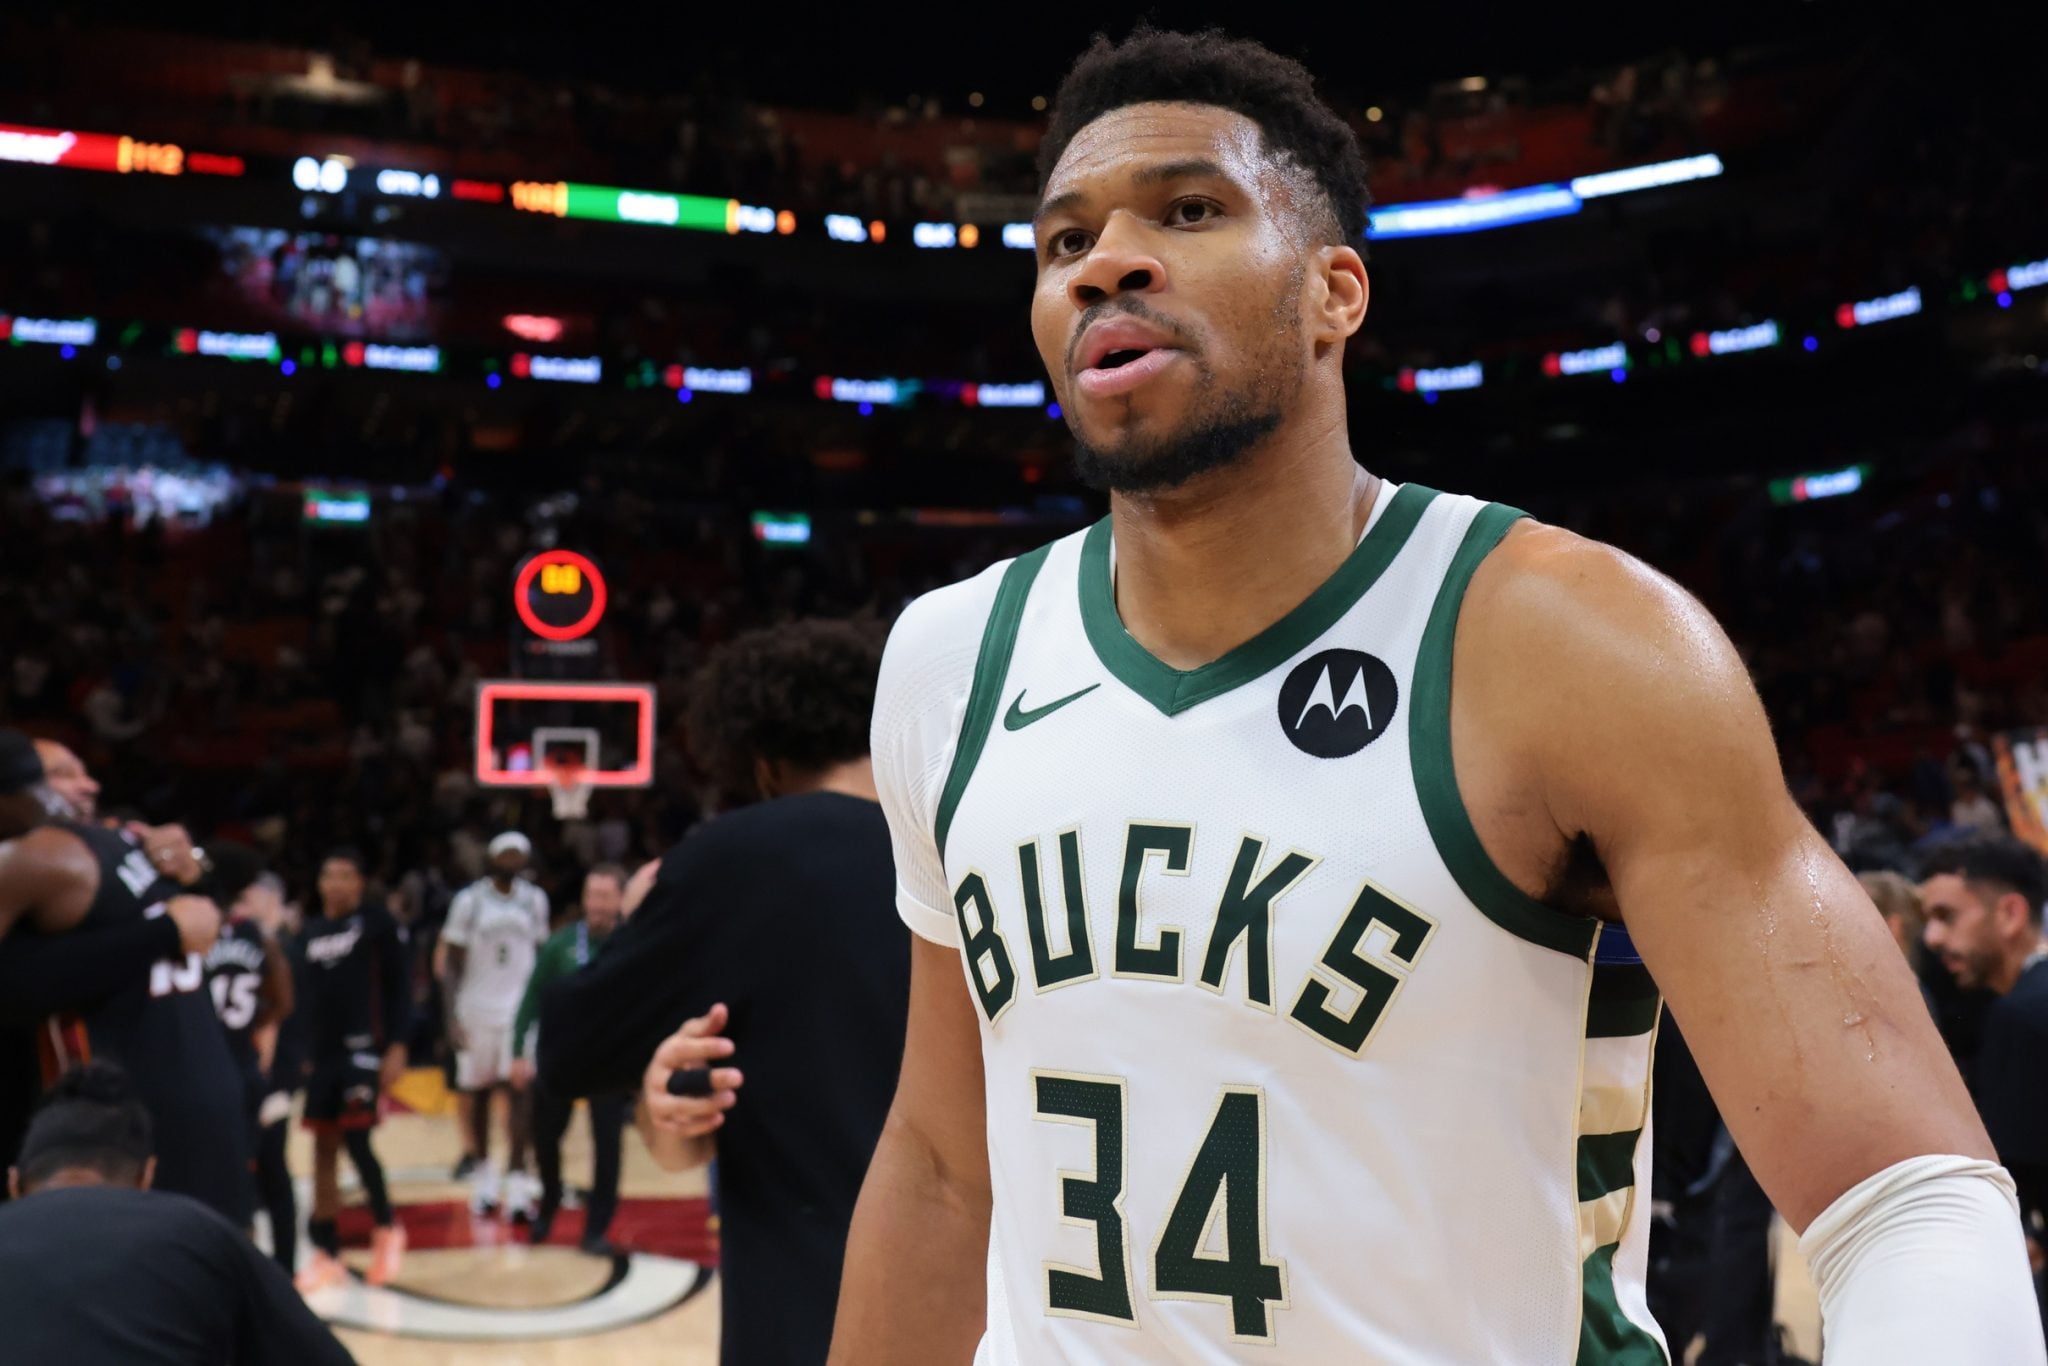
Report: Milwaukee Bucks open to trade offers for Giannis Antetokounmpo
Giannis Antetokounmpo is the Milwaukee Bucks’ franchise leader in games played, minutes played, total points, total assists and total rebounds.
2026 FIFA World Cup: Bosnia and Herzegovina, Canada’s first opponent, announces full squad
Canada can start game planning for their first opponent at the 2026 FIFA World Cup.

PGA Championship Predictions and Bets Bets: Is Xander Schauffele the play this week?
The year’s second major tees off this week with the PGA Championship at Aronimink Golf Club outside of Philadelphia, Pennsylvania.

Anaheim Ducks vs. Vegas Golden Knights Game 5 Prediction, NHL Odds
It’s now a best-of-three between the Anaheim Ducks and Vegas Golden Knights as their second-round series now shifts back to Vegas for Game 5 on Tuesday night.

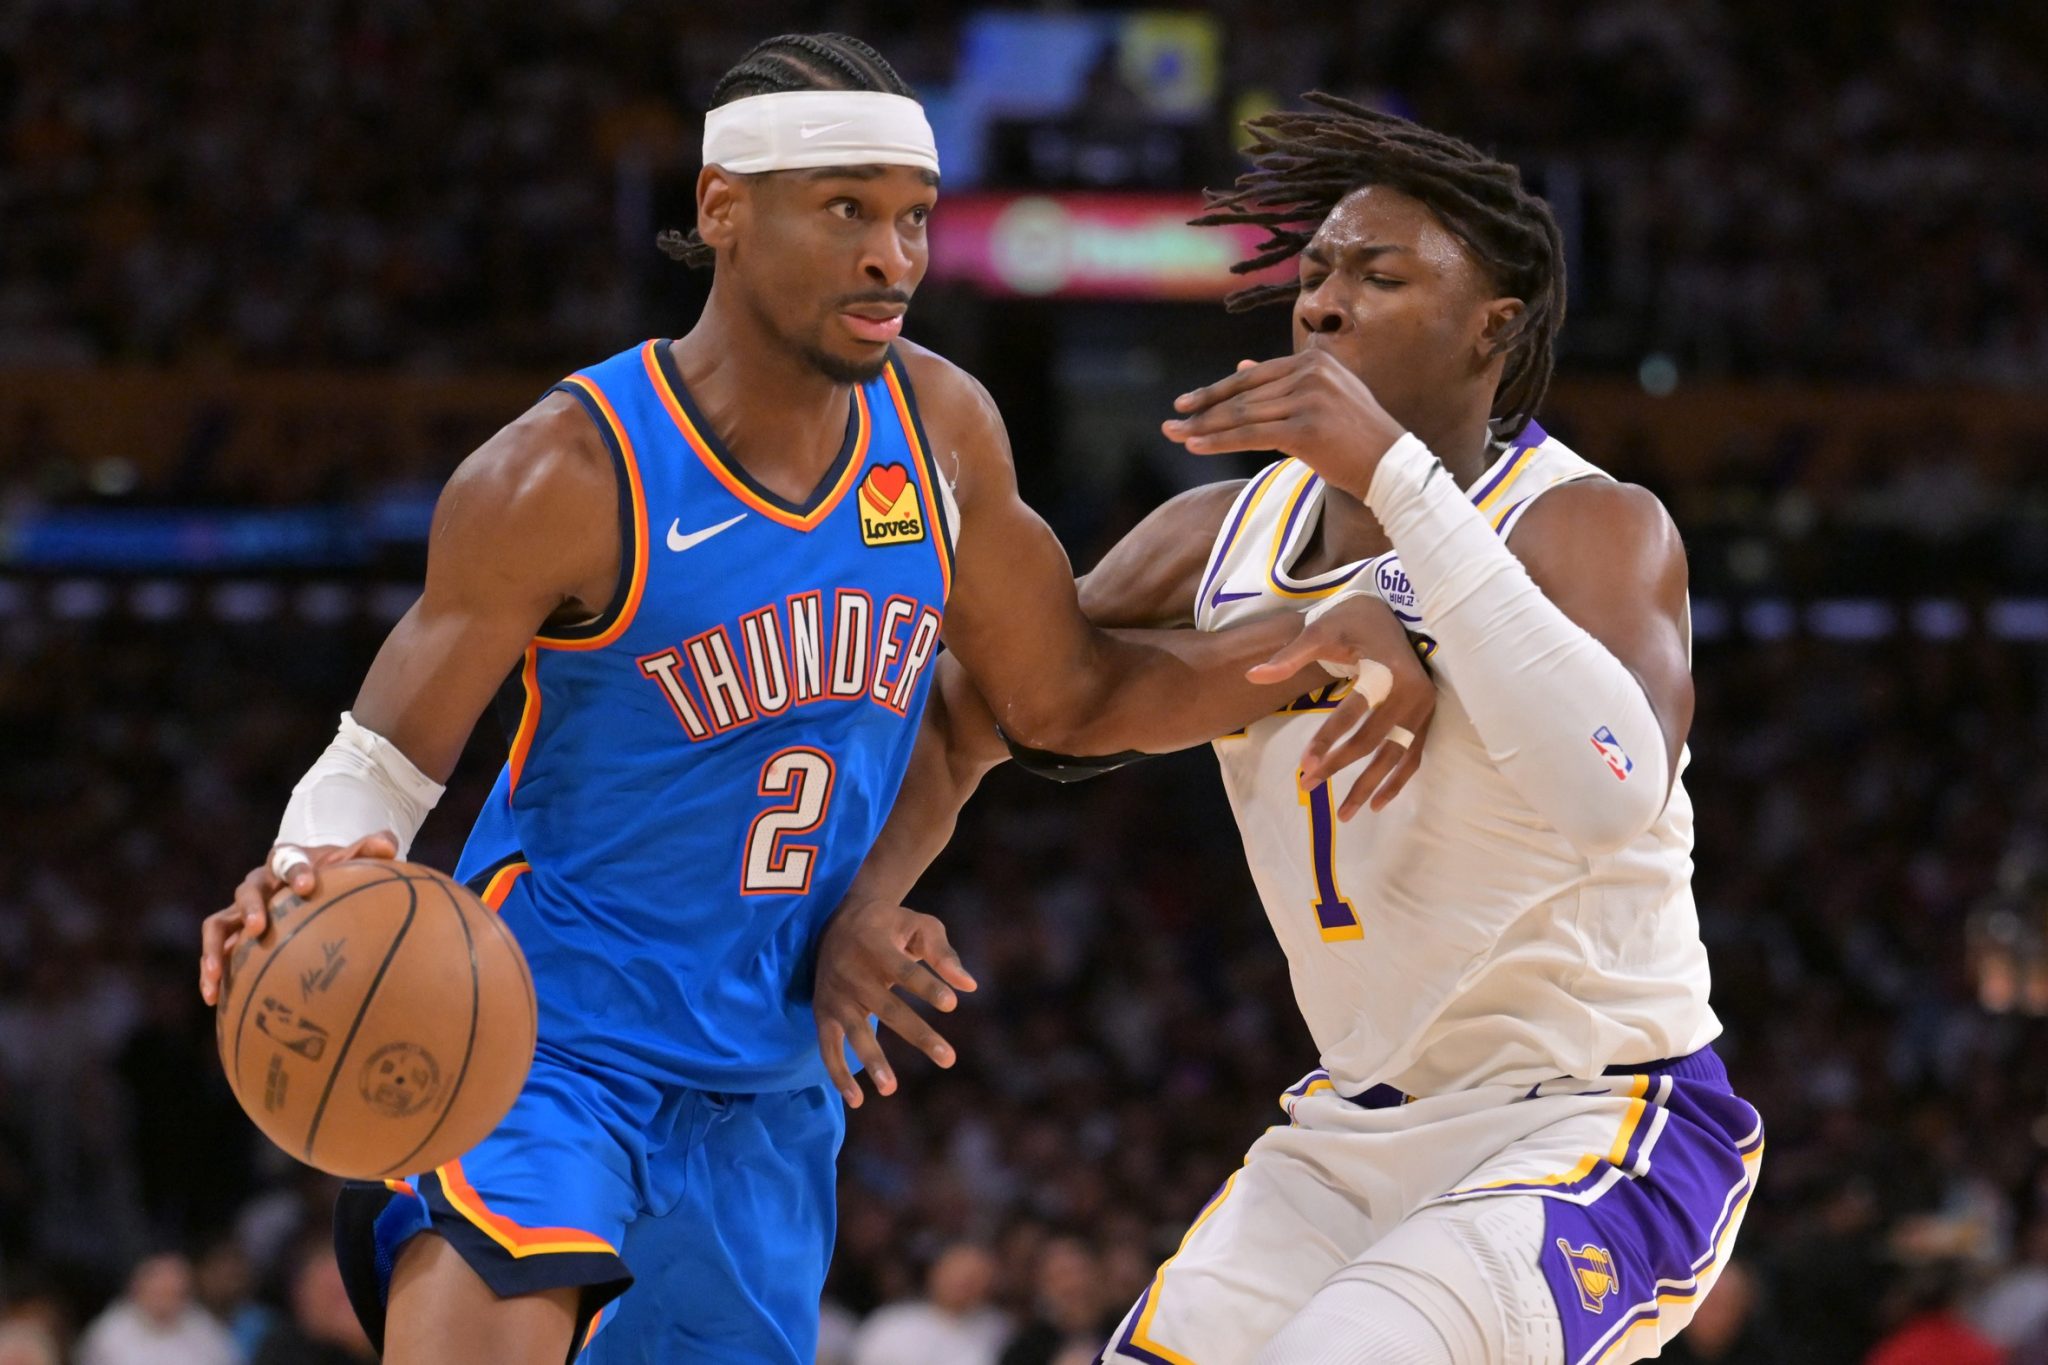
Oklahoma City Thunder vs. Los Angeles Lakers Game 4 Prediction, NBA Odds
The visiting Oklahoma City Thunder look for their second straight playoff series sweep this evening at 10:30 PM ET.
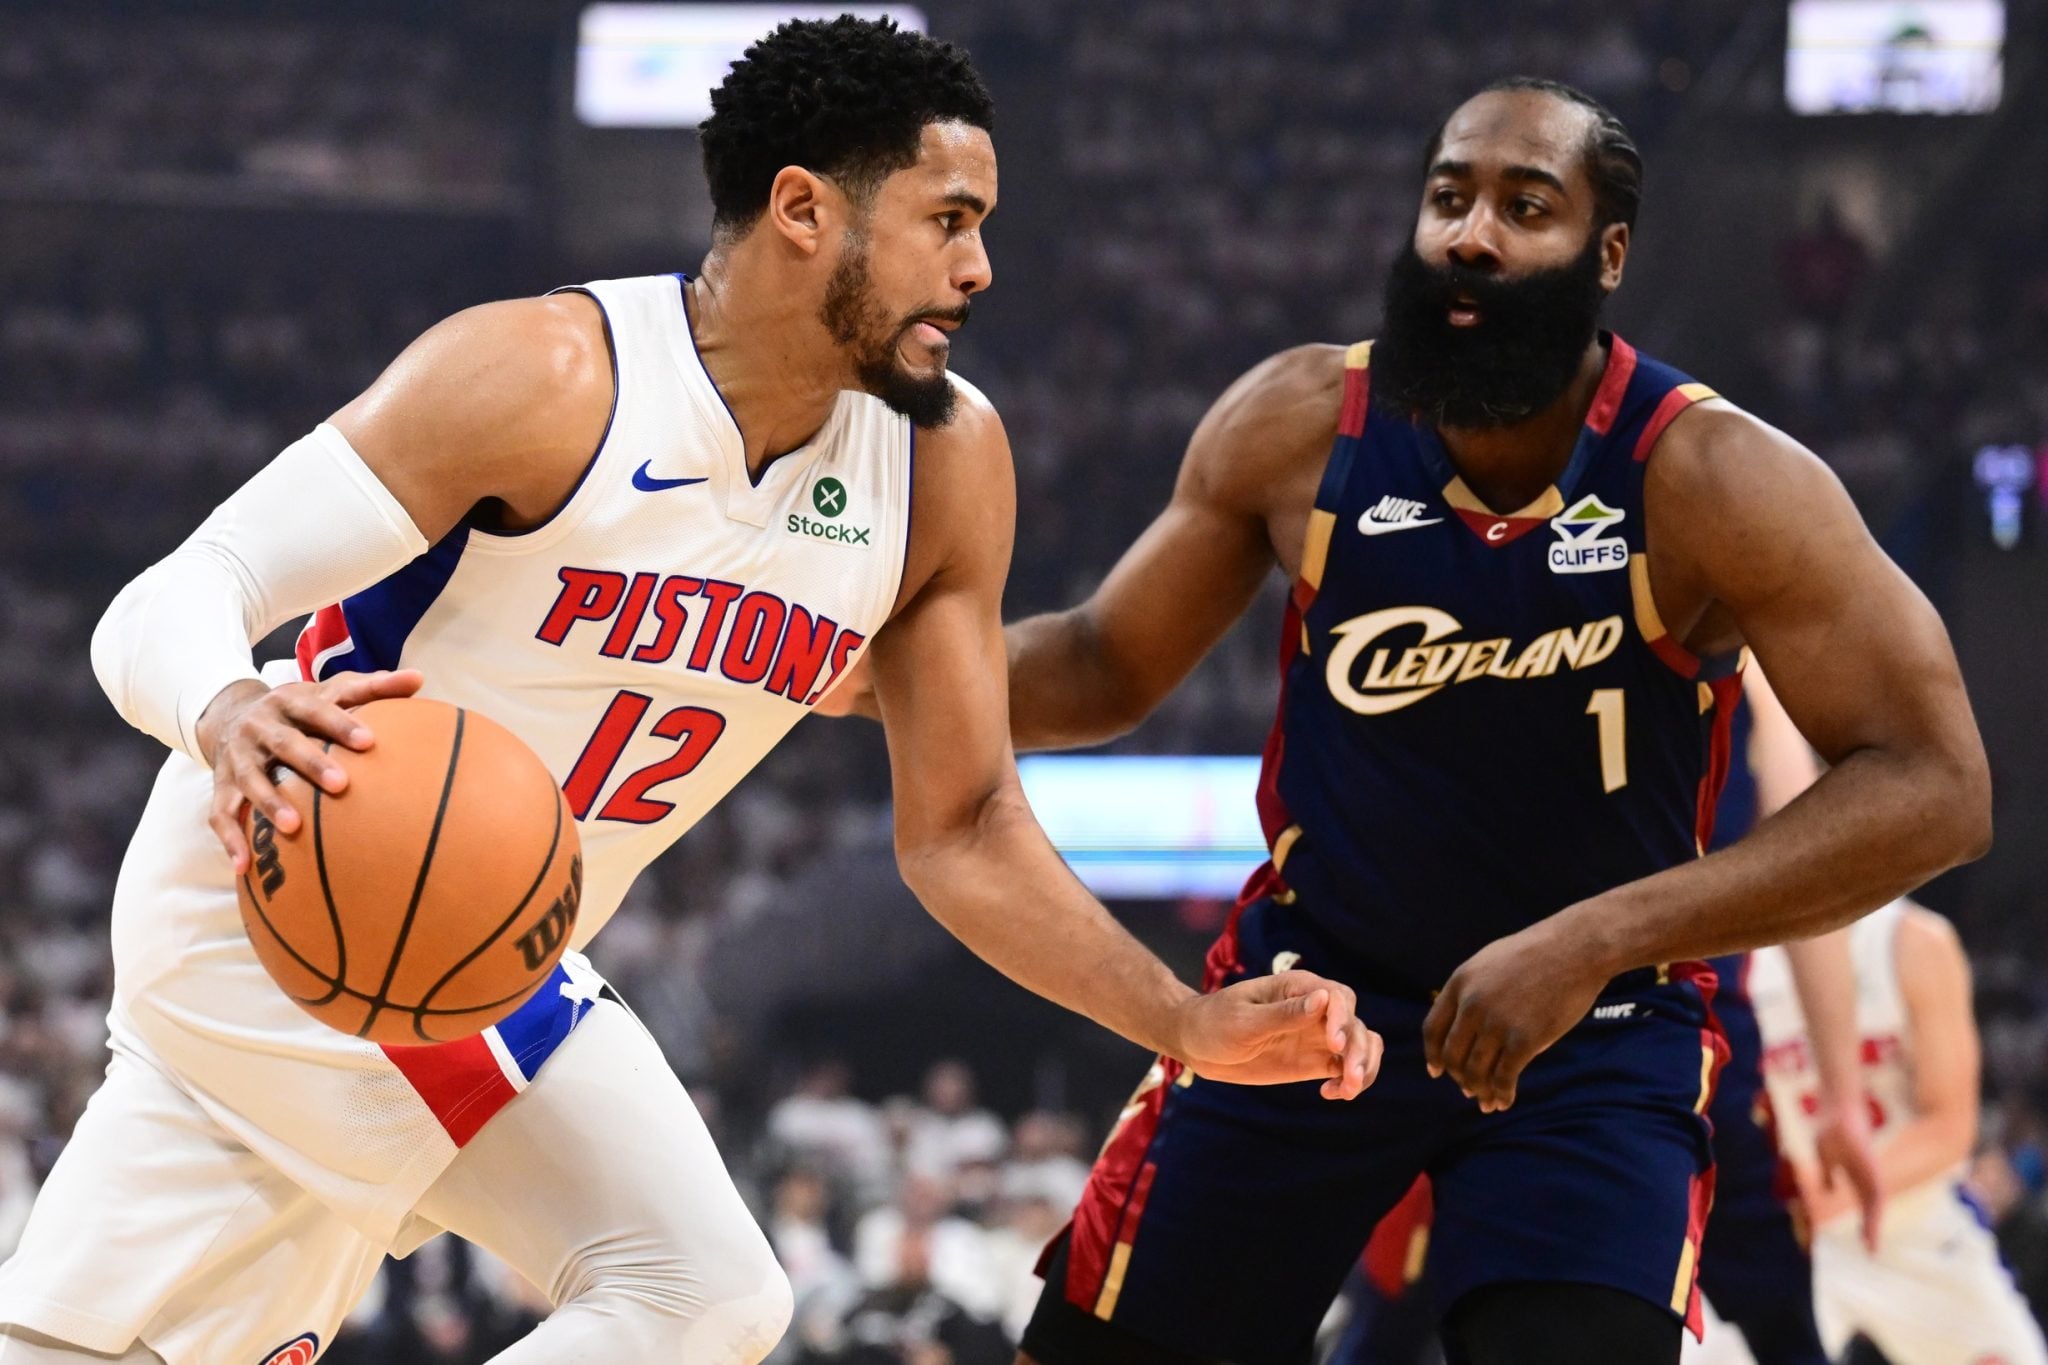
Detroit Pistons vs. Cleveland Cavaliers Game 4 Prediction, NBA Odds
The Eastern Conference Semifinals have shifted into a high-stakes chess match as the Cleveland Cavaliers host the Detroit Pistons for a pivotal Game 4.
Colorado Avalanche vs. Minnesota Wild Game 4 Prediction, NHL Playoff Odds
The Minnesota Wild aim to build on a decisive 5-1 victory in Game 3 when they return to action on Monday night in Game 4 of their second-round NHL playoff series with the Colorado Avalanche at Grand Casino Arena.

-
 Sports Interaction Staff
New York Yankees vs. Baltimore Orioles: Odds, Prediction
In an AL East tilt to kick off the new week, the New York Yankees head to Baltimore to take on the Orioles in a three-game early-week set.

Buffalo Sabres vs. Montreal Canadiens Game 4 Prediction, NHL Odds
Parker Kelly, Avalanche push Wild to brink with Game 4 win
Report: Milwaukee Bucks open to trade offers for Giannis Antetokounmpo
2026 FIFA World Cup: Bosnia and Herzegovina, Canada’s first opponent, announces full squad
PGA Championship Predictions and Bets Bets: Is Xander Schauffele the play this week?
Anaheim Ducks vs. Vegas Golden Knights Game 5 Prediction, NHL Odds
Oklahoma City Thunder vs. Los Angeles Lakers Game 4 Prediction, NBA Odds
Detroit Pistons vs. Cleveland Cavaliers Game 4 Prediction, NBA Odds
Colorado Avalanche vs. Minnesota Wild Game 4 Prediction, NHL Playoff Odds
-
Sports Interaction Staff
New York Yankees vs. Baltimore Orioles: Odds, Prediction


