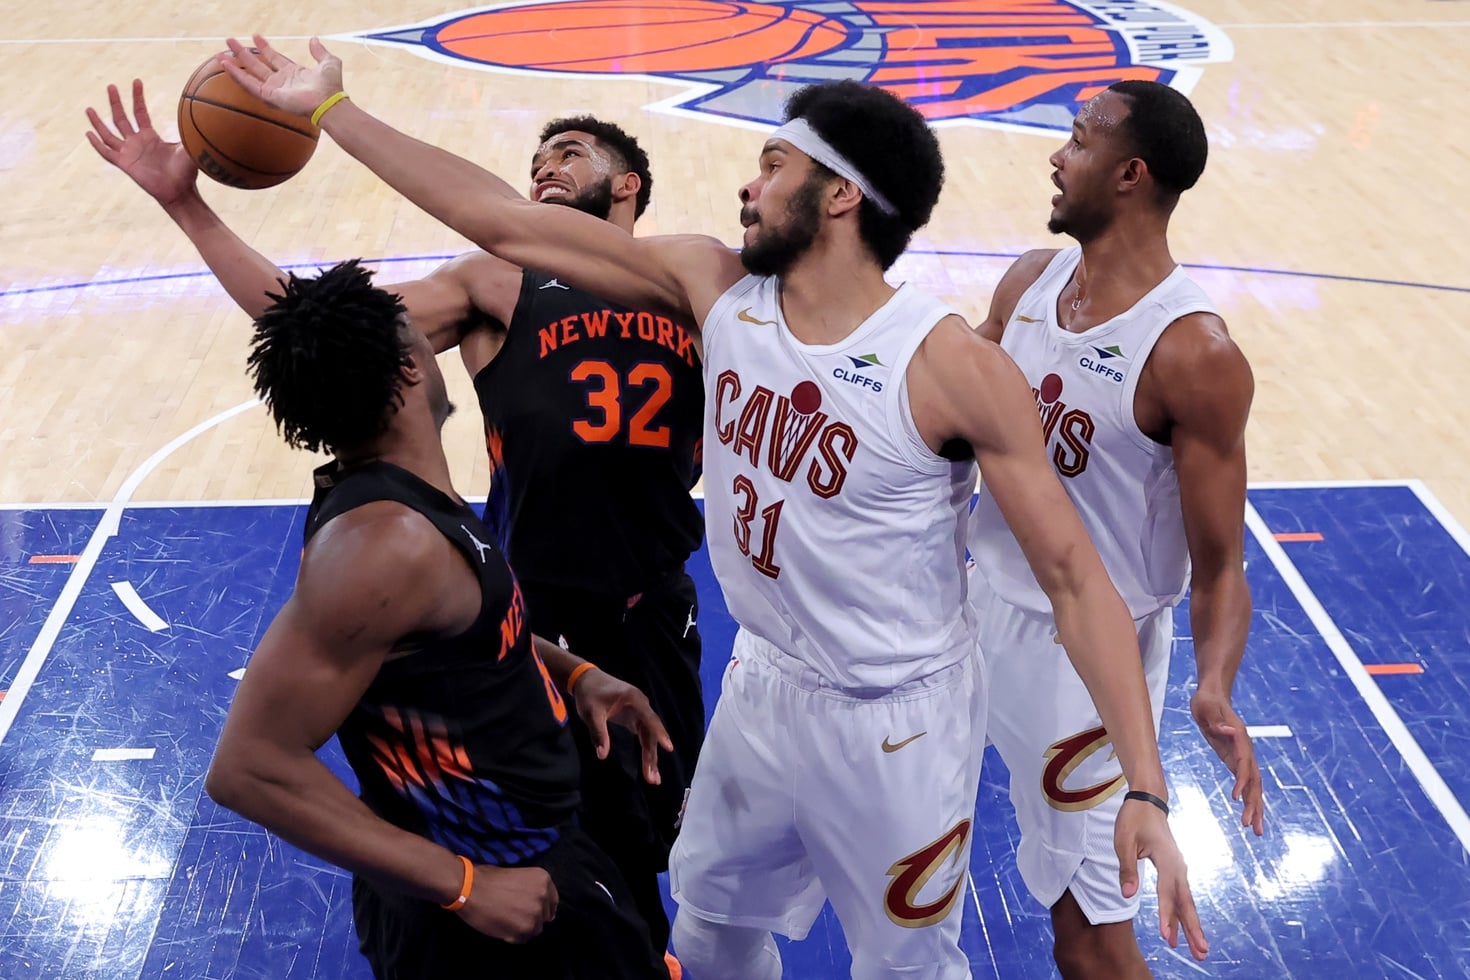
Knicks vs. Cavaliers Game 3 Prediction, Eastern Conference Final Odds
The Eastern Conference Finals shift to Rocket Mortgage FieldHouse on Saturday with the New York Knicks halfway to their first NBA Finals appearance since 1999.
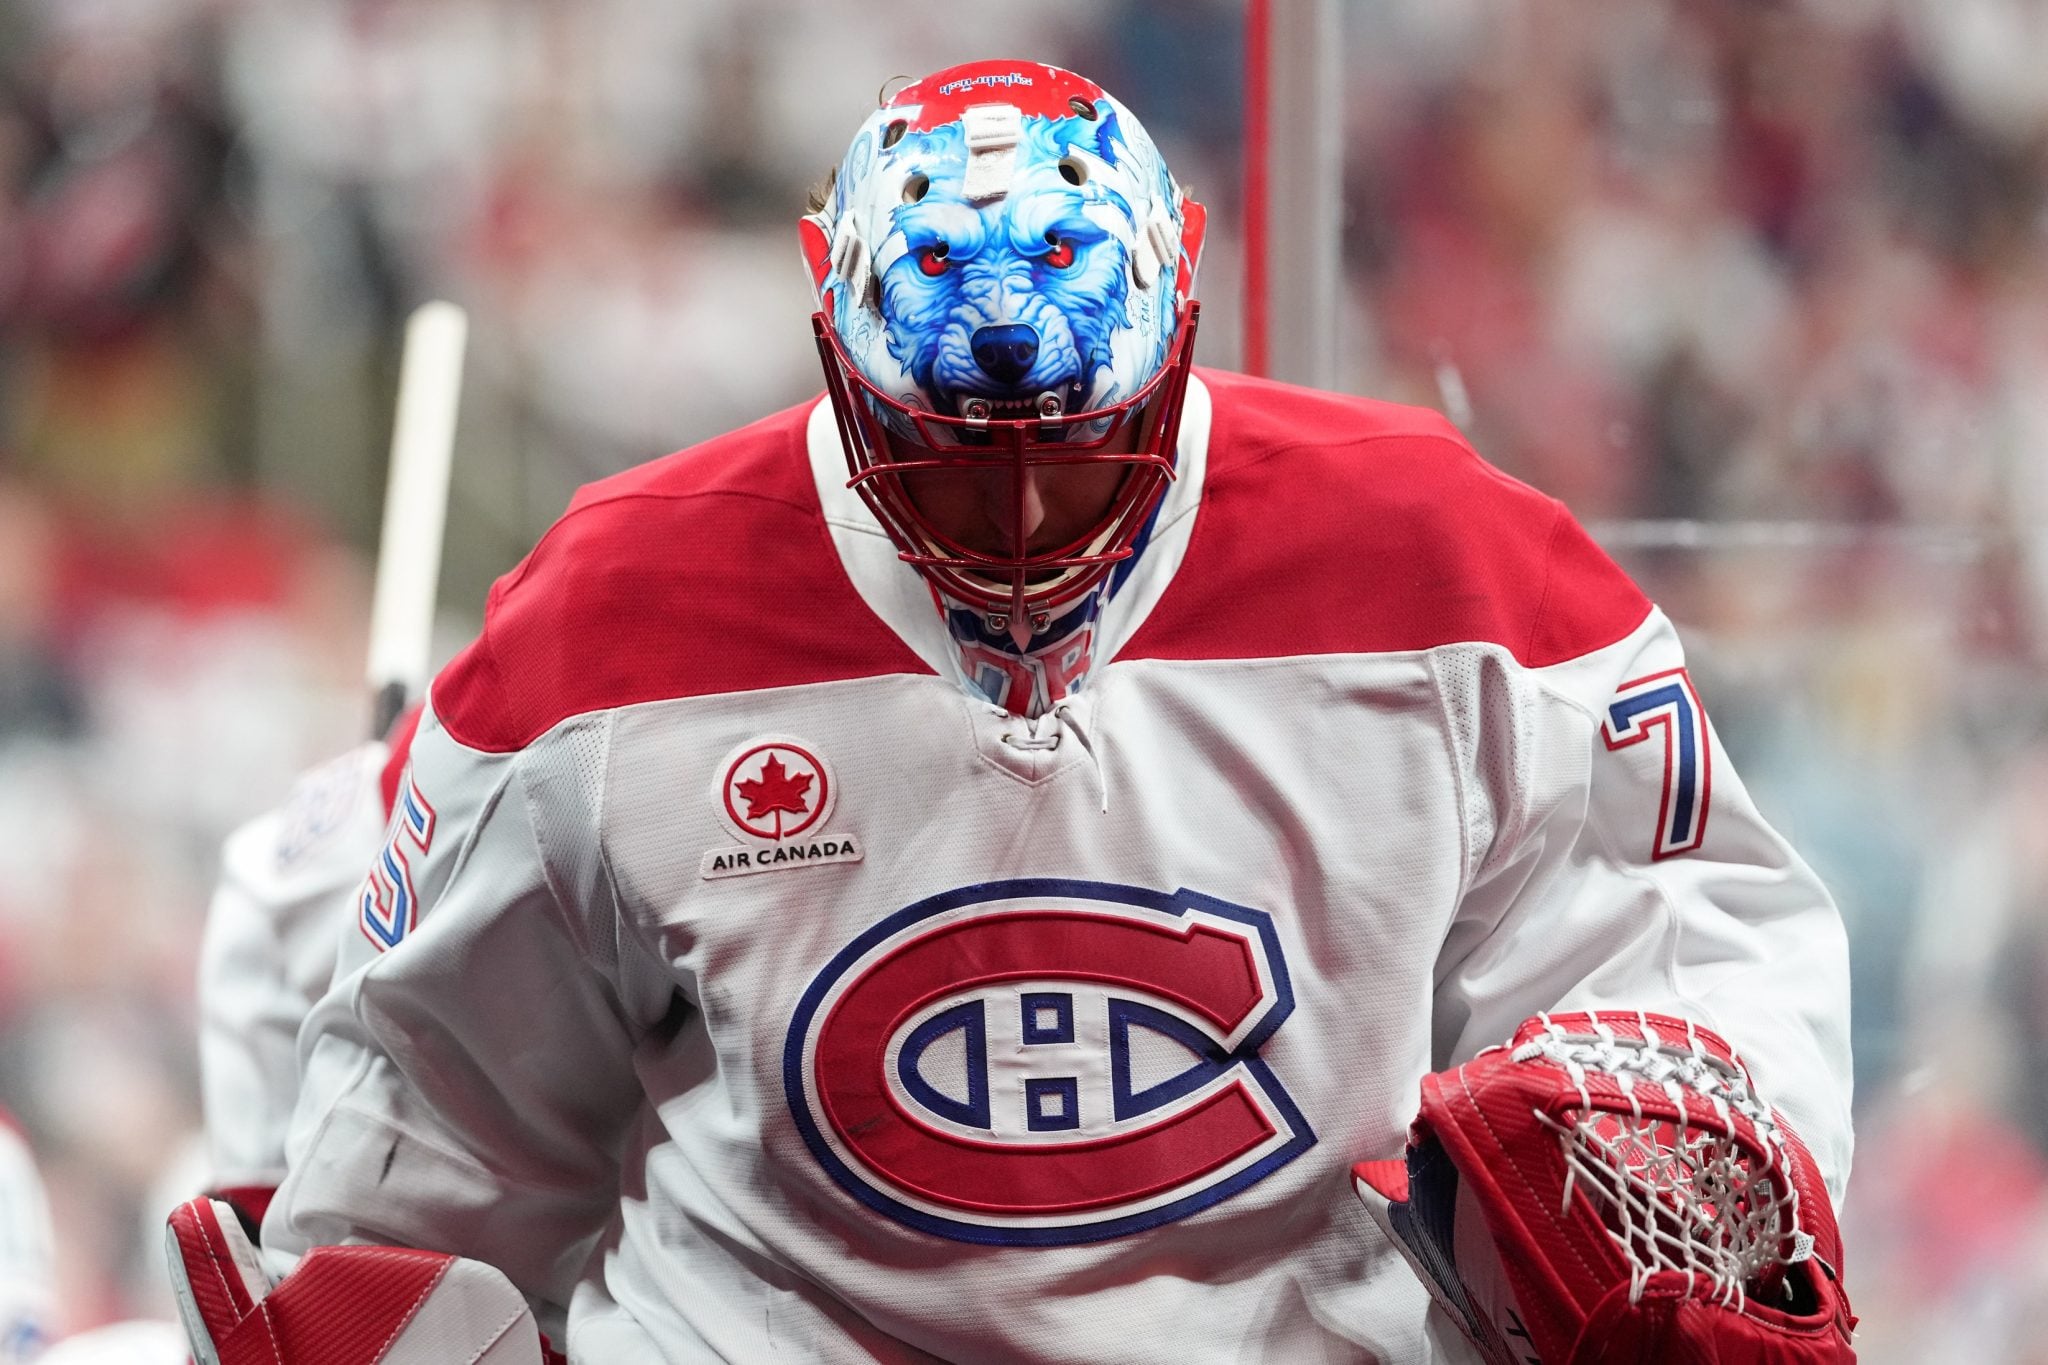
Montreal Canadiens vs. Carolina Hurricanes Game 2 Prediction, NHL Playoff Odds
The Montreal Canadiens already have stolen home-ice advantage from top-seeded Carolina in the Eastern Conference Finals entering Saturday night’s Game 2 from Raleigh.
Inter Miami vs. Philadelphia Union MLS Preview and Prediction
Sunday night’s Eastern Conference showdown pits the league’s most dangerous attack against one of its worst-performing sides, as Inter Miami welcomes the Philadelphia Union to Chase Stadium.

San Diego FC vs. Vancouver Whitecaps MLS Preview and Prediction
The Vancouver Whitecaps are returning to California this Saturday night for a Western Conference clash against San Diego FC.

Chicago Fire vs. Toronto FC MLS Preview and Prediction
Get ready for a gritty Eastern Conference clash in the final week of the MLS before players head to World Cup international duty for the summer.

DC United vs. CF Montreal MLS Preview and Prediction
Matchday 15 of the MLS season features plenty of action as eighth-place DC United takes on an adjusting 12th-place CF Montreal side.

Palmer, Foden, Maguire among biggest snubs from England’s FIFA World Cup squad
Thomas Tuchel’s 26-man roster was confirmed on Friday morning and multiple international regulars won’t suit up for the Three Lions in June and July.

Vegas Golden Knights vs. Colorado Avalanche Game 2 Prediction, NHL Playoff Odds
The Vegas Golden Knights look to take a commanding 2-0 series lead in the Western Conference Final when they battle the Colorado Avalanche in Game 2 on Friday night at Ball Arena.

Pittsburgh Pirates vs. Toronto Blue Jays: Odds, Prediction
The Blue Jays return home from a seven-game road trip on Friday night by welcoming the co-last-place team in the NL Central, the Pittsburgh Pirates.

-
Kevin Thompkins
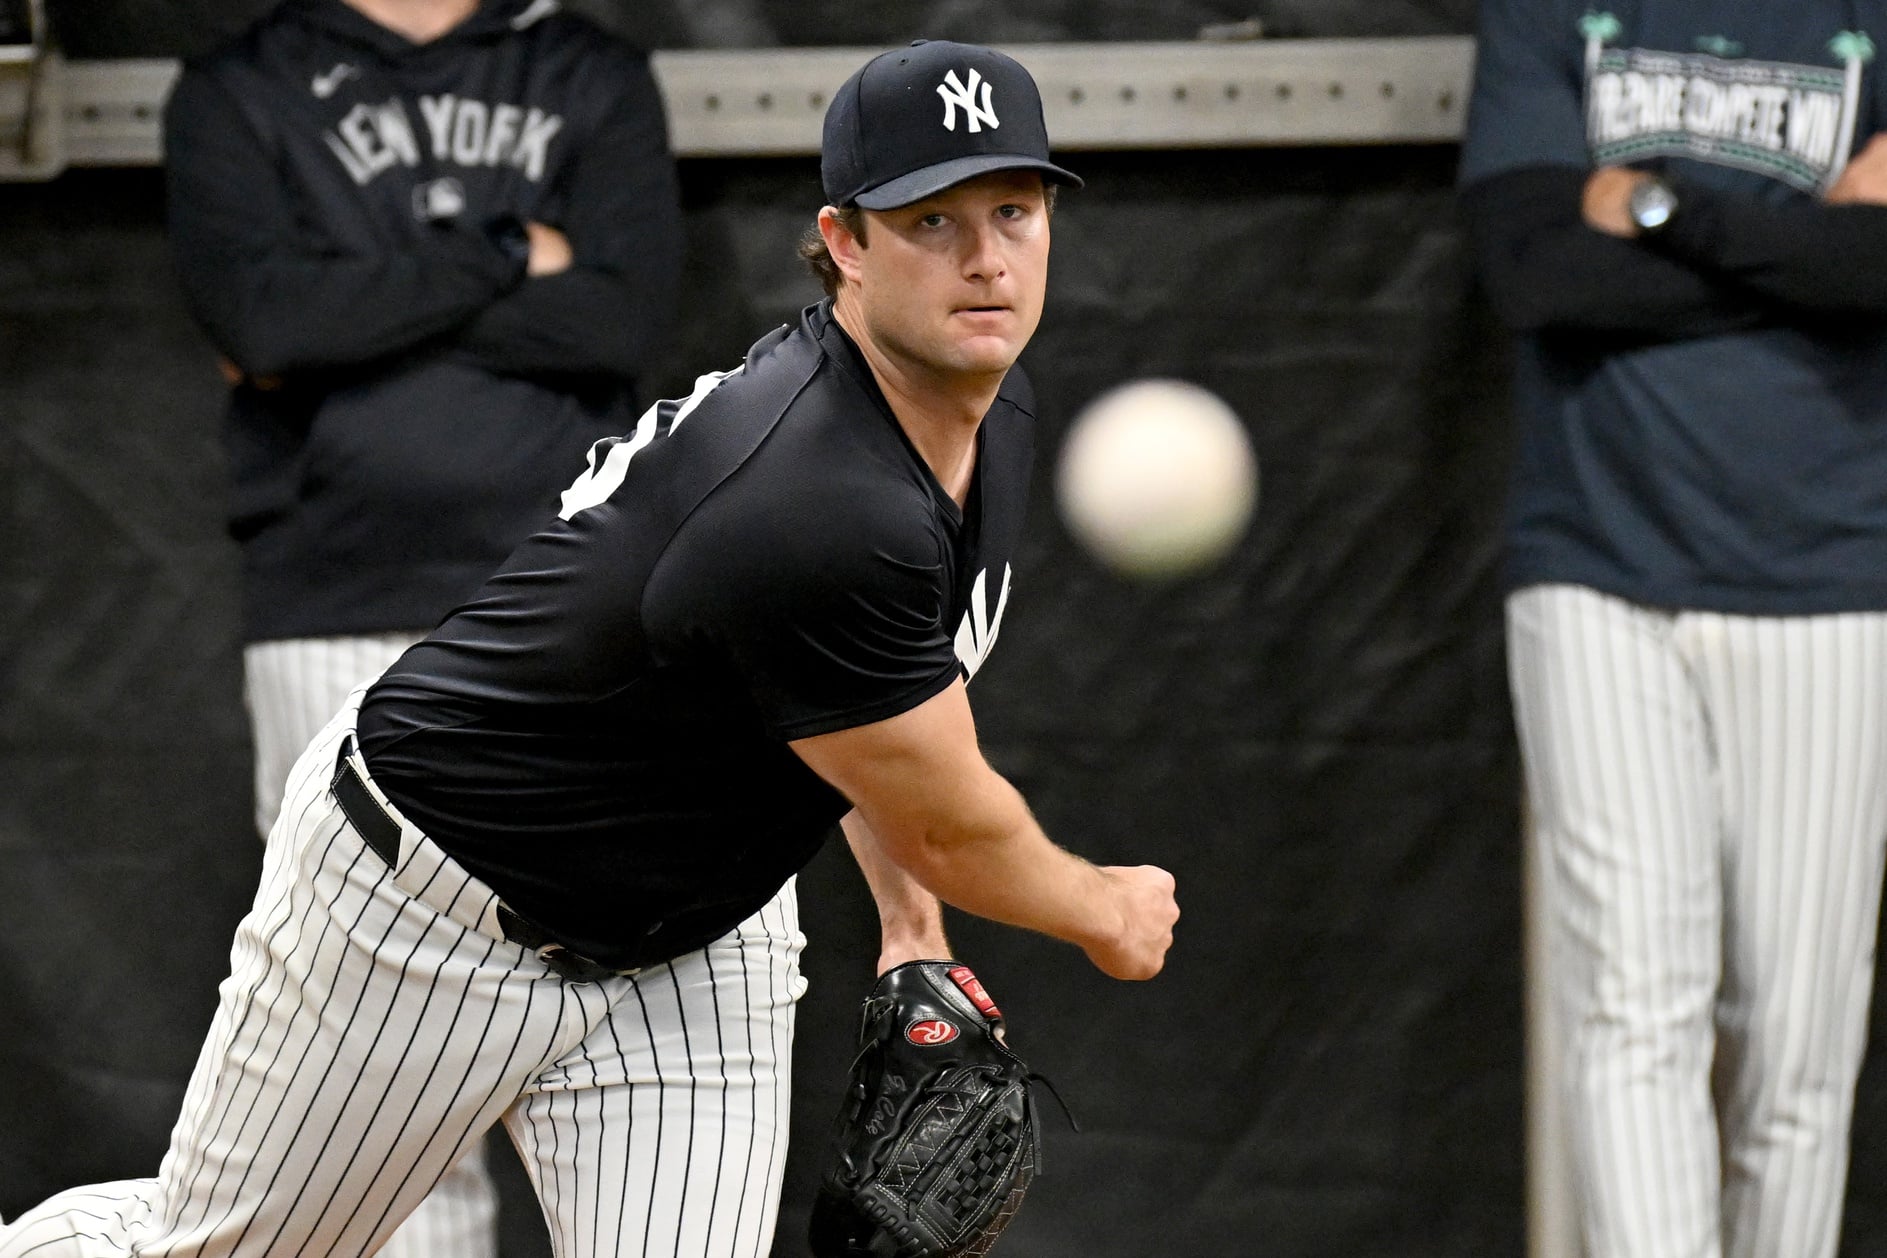
Tampa Bay Rays vs. New York Yankees: Odds, Prediction
Gerrit Cole makes his season debut tonight, and his return could spark a return to form for the Yankees.
Knicks vs. Cavaliers Game 3 Prediction, Eastern Conference Final Odds
Montreal Canadiens vs. Carolina Hurricanes Game 2 Prediction, NHL Playoff Odds
Inter Miami vs. Philadelphia Union MLS Preview and Prediction
San Diego FC vs. Vancouver Whitecaps MLS Preview and Prediction
Chicago Fire vs. Toronto FC MLS Preview and Prediction
DC United vs. CF Montreal MLS Preview and Prediction
Palmer, Foden, Maguire among biggest snubs from England’s FIFA World Cup squad
Vegas Golden Knights vs. Colorado Avalanche Game 2 Prediction, NHL Playoff Odds
Pittsburgh Pirates vs. Toronto Blue Jays: Odds, Prediction
-
Tampa Bay Rays vs. New York Yankees: Odds, Prediction


