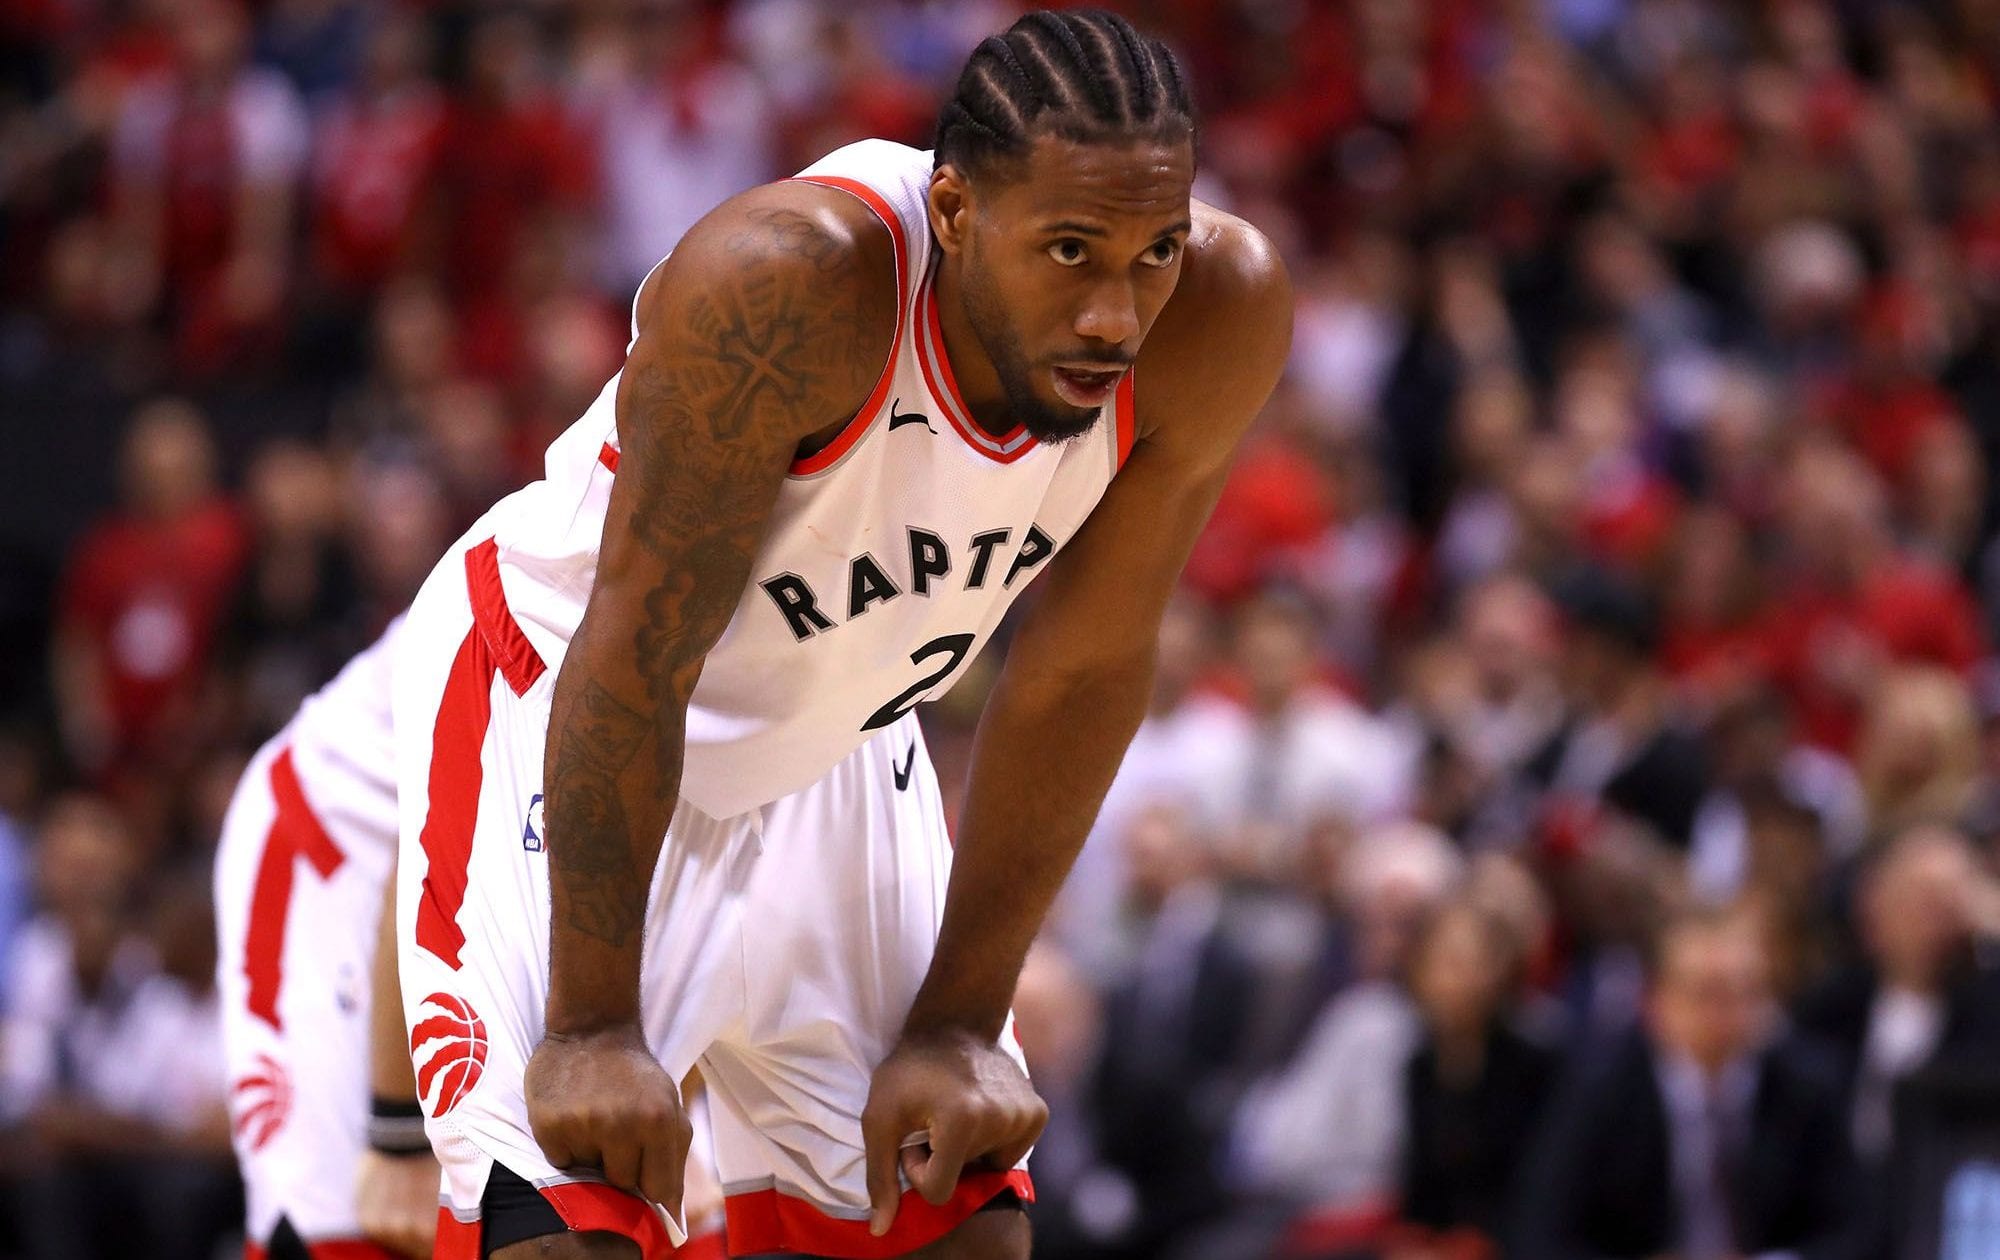
Report: Raptors closing deal with Clippers to send Kawhi Leonard back to Toronto
The main piece of the Toronto Raptors 2019 championship team is coming back north of the border.
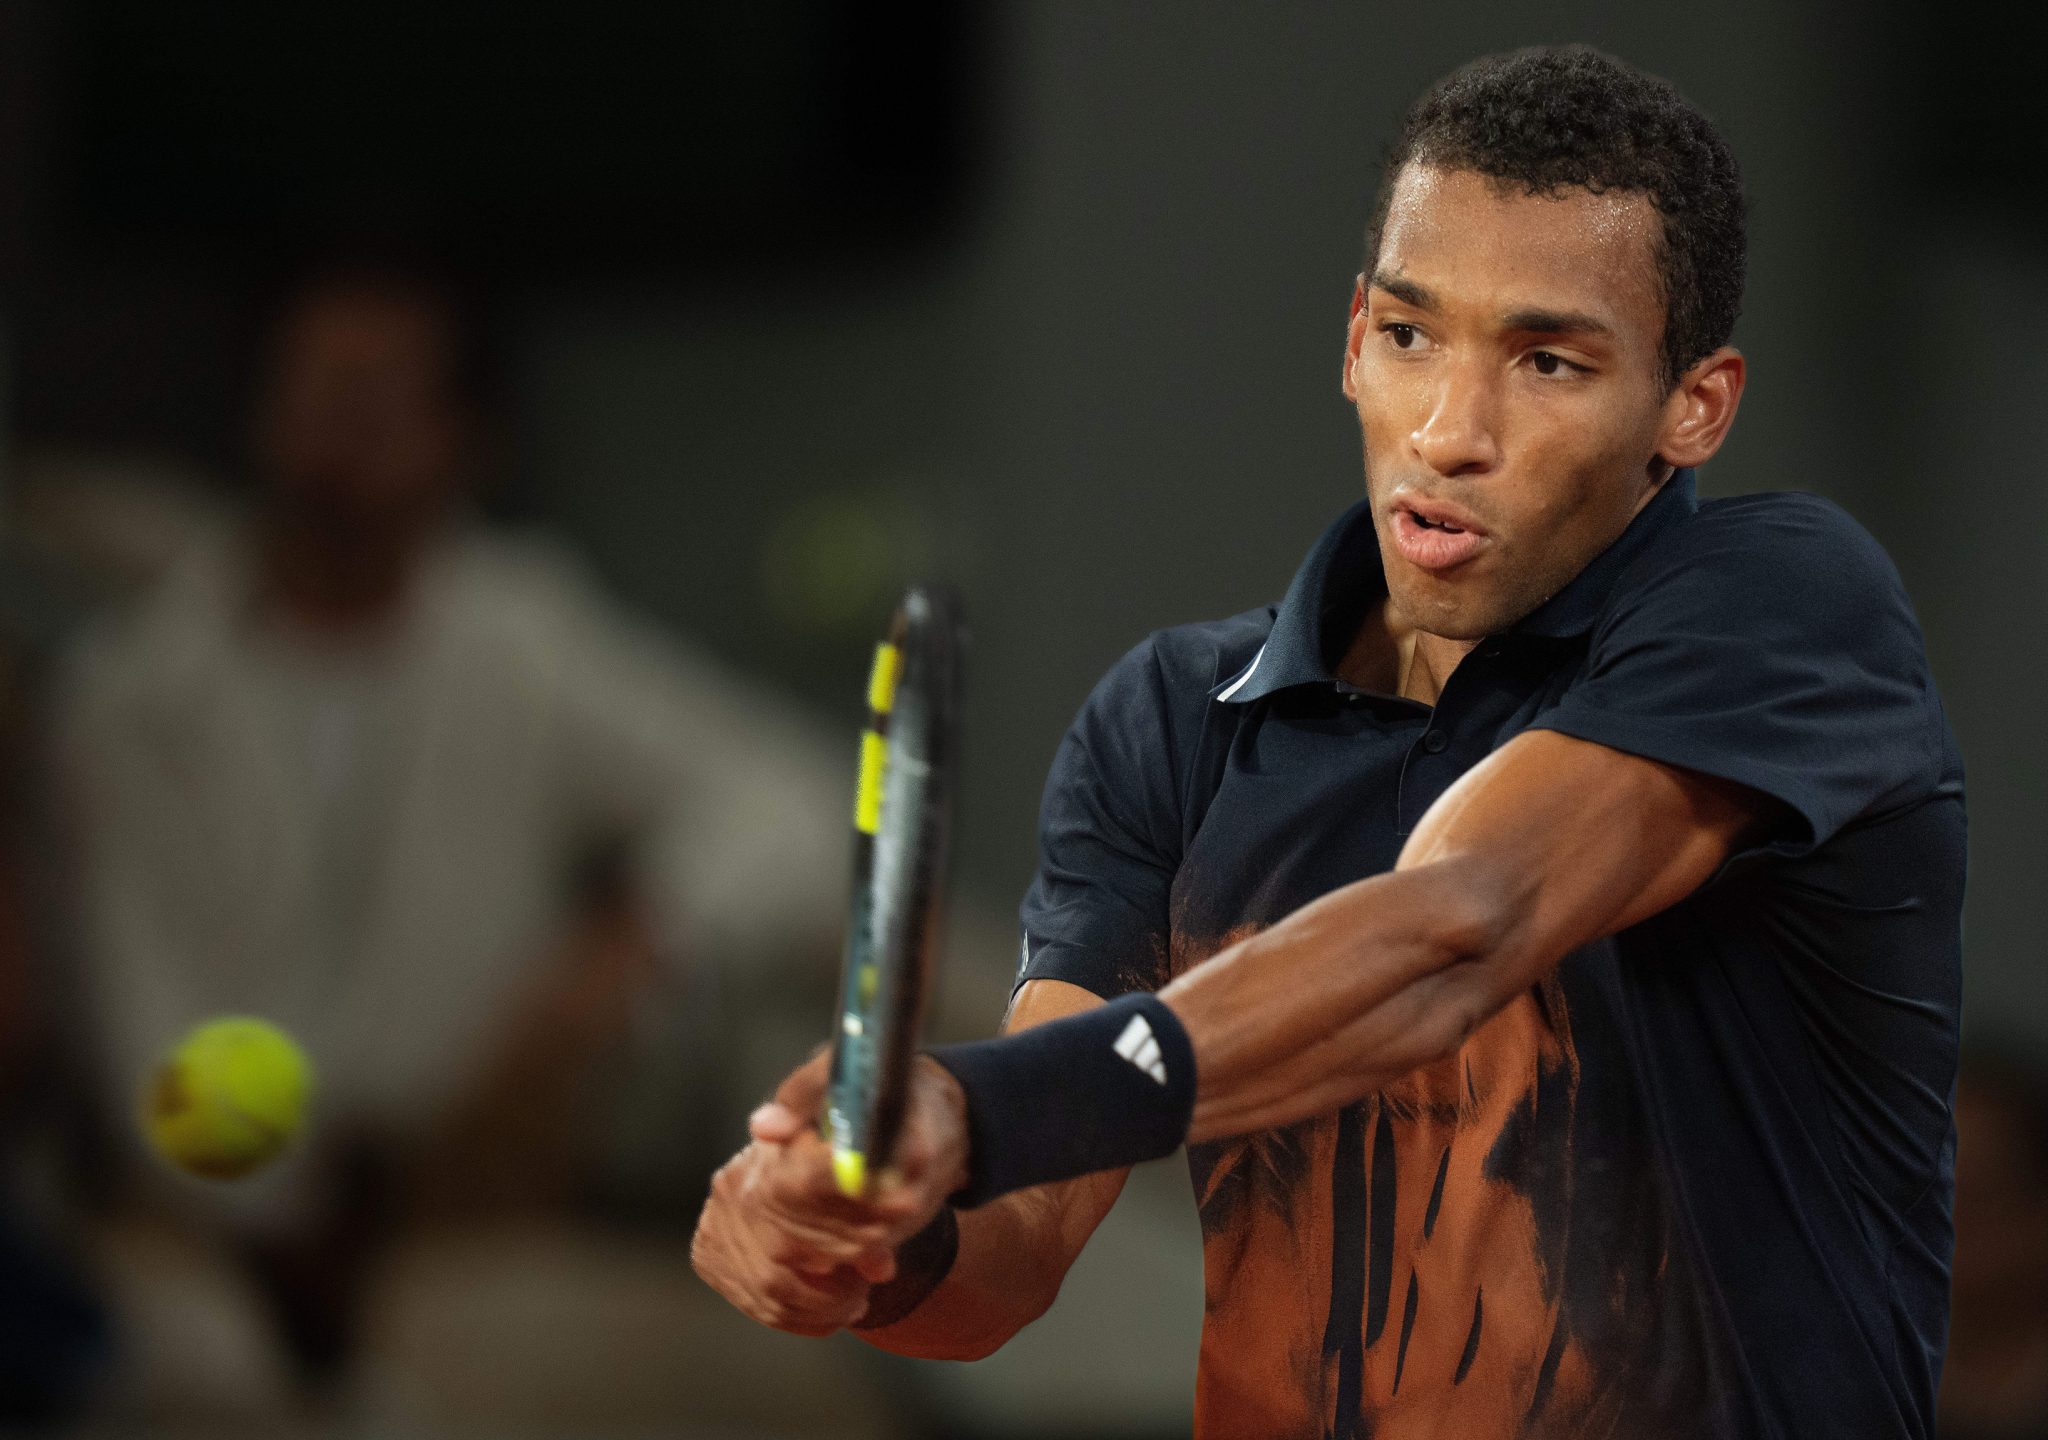
Wimbledon second round preview and predictions, featuring Felix Auger-Aliassime and Novak Djokovic
Felix-Auger-Aliassime headlines the shortlist of Canadians advancing to the second round of Wimbledon.
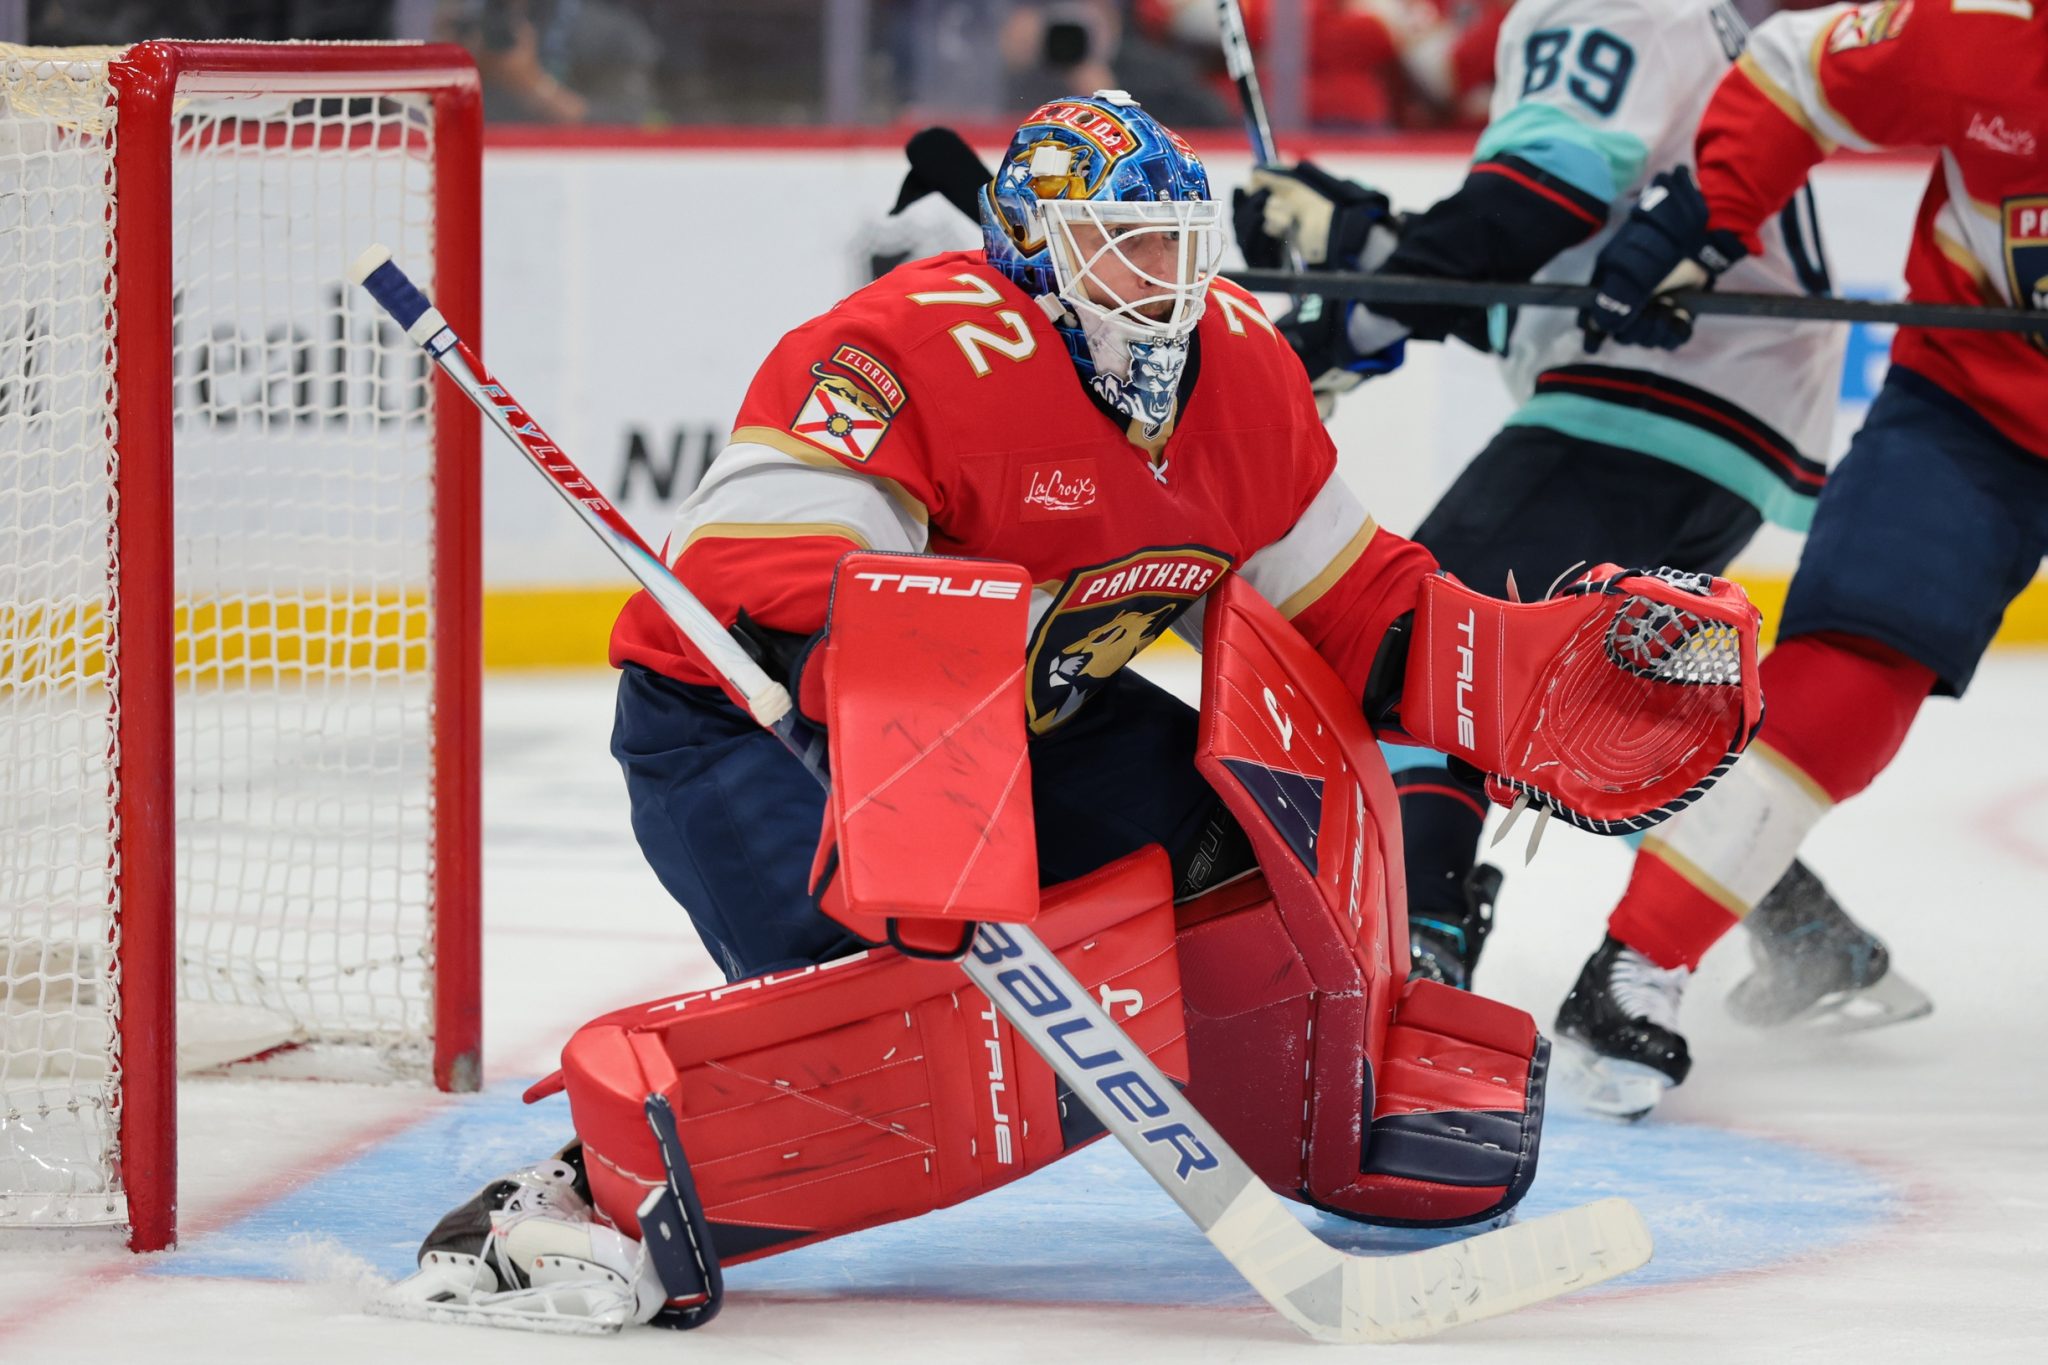
2026 NHL Free Agency Preview, Top Targets and Rumours
It’s Christmas in July for hockey fans as free agency officially gets underway at 12 p.m. ET on Canada Day.
Belgium vs. Senegal Round of 32 Prediction: FIFA World Cup Odds, Betting Picks
Belgium’s offence has come to life at the right time as they prepare for a Round of 32 matchup against Senegal on Wednesday.

-
Kevin Thompkins
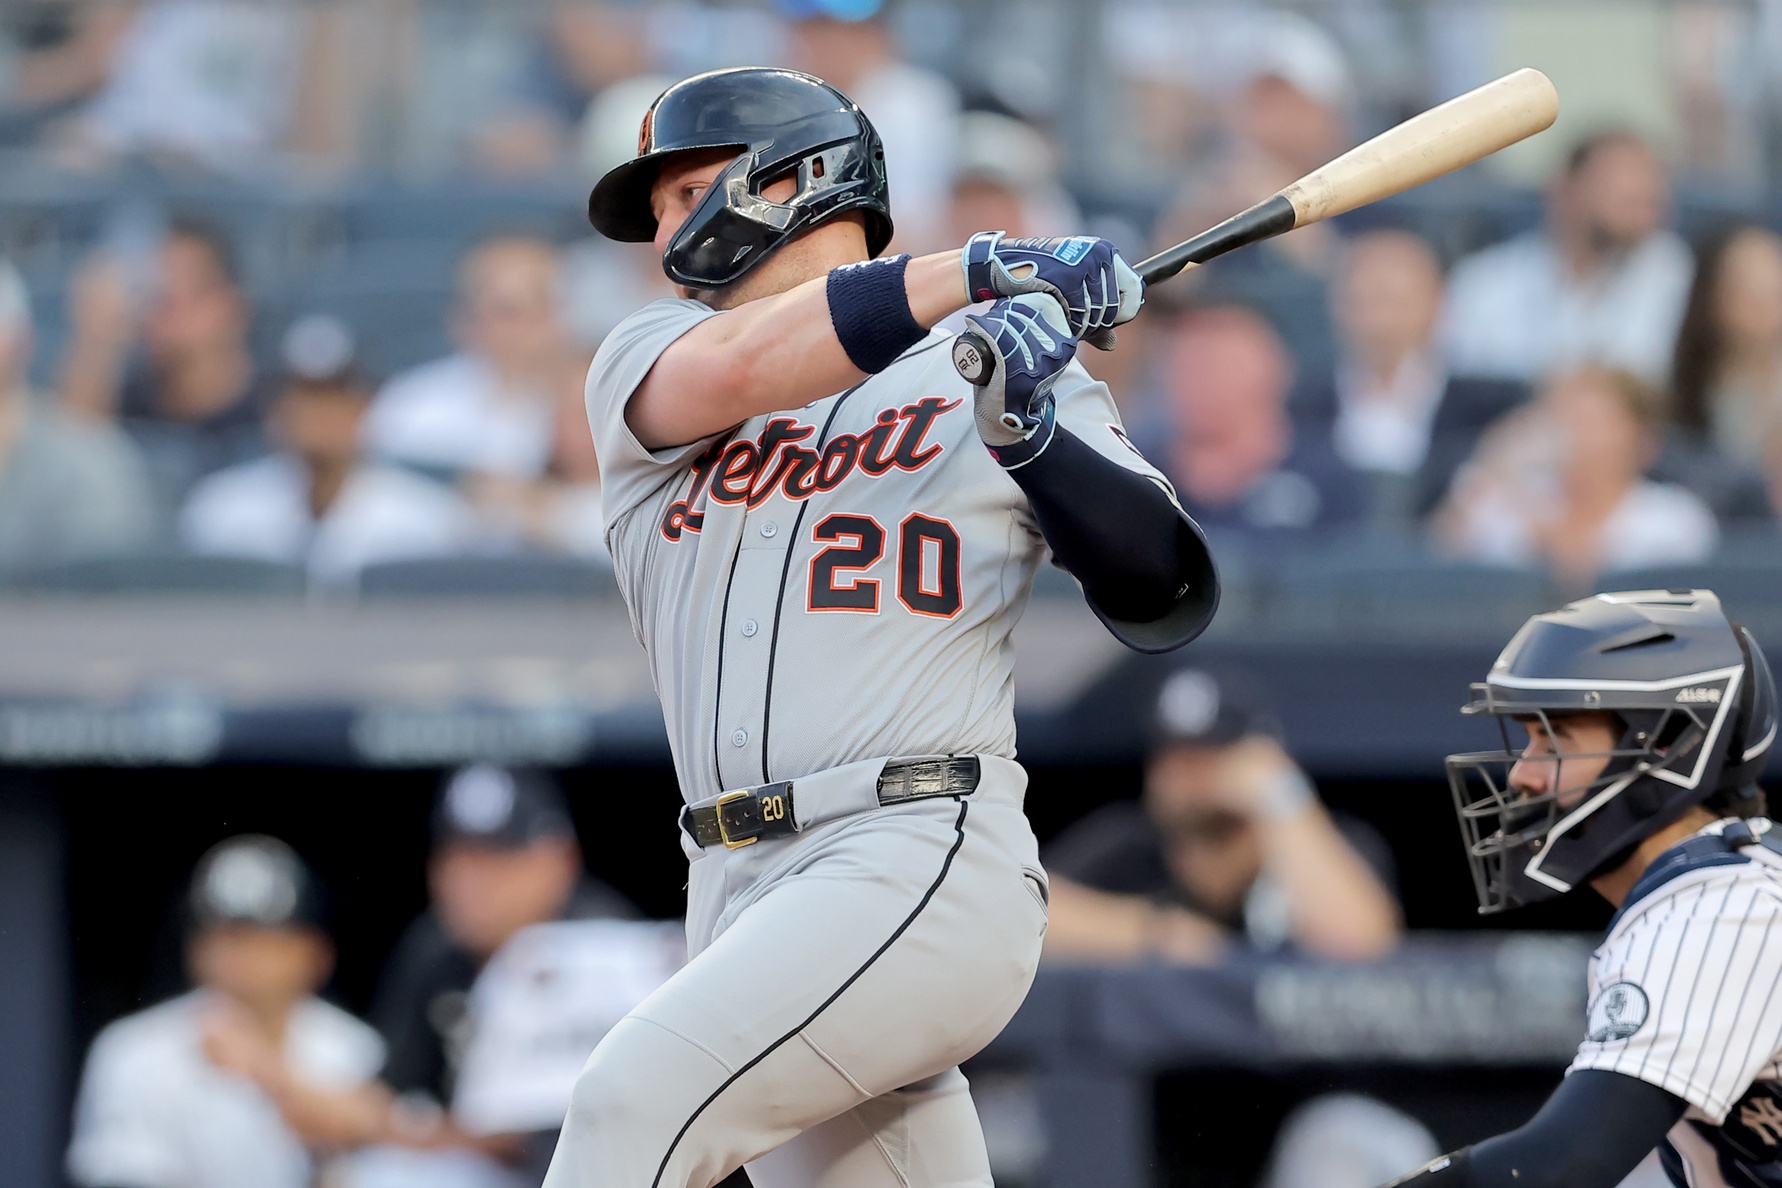
Detroit Tigers vs. New York Yankees: Odds, Prediction
The Detroit Tigers (36-49) and New York Yankees (48-36) will meet up for the second game of this early-week three-game series at Yankee Stadium on Tuesday.
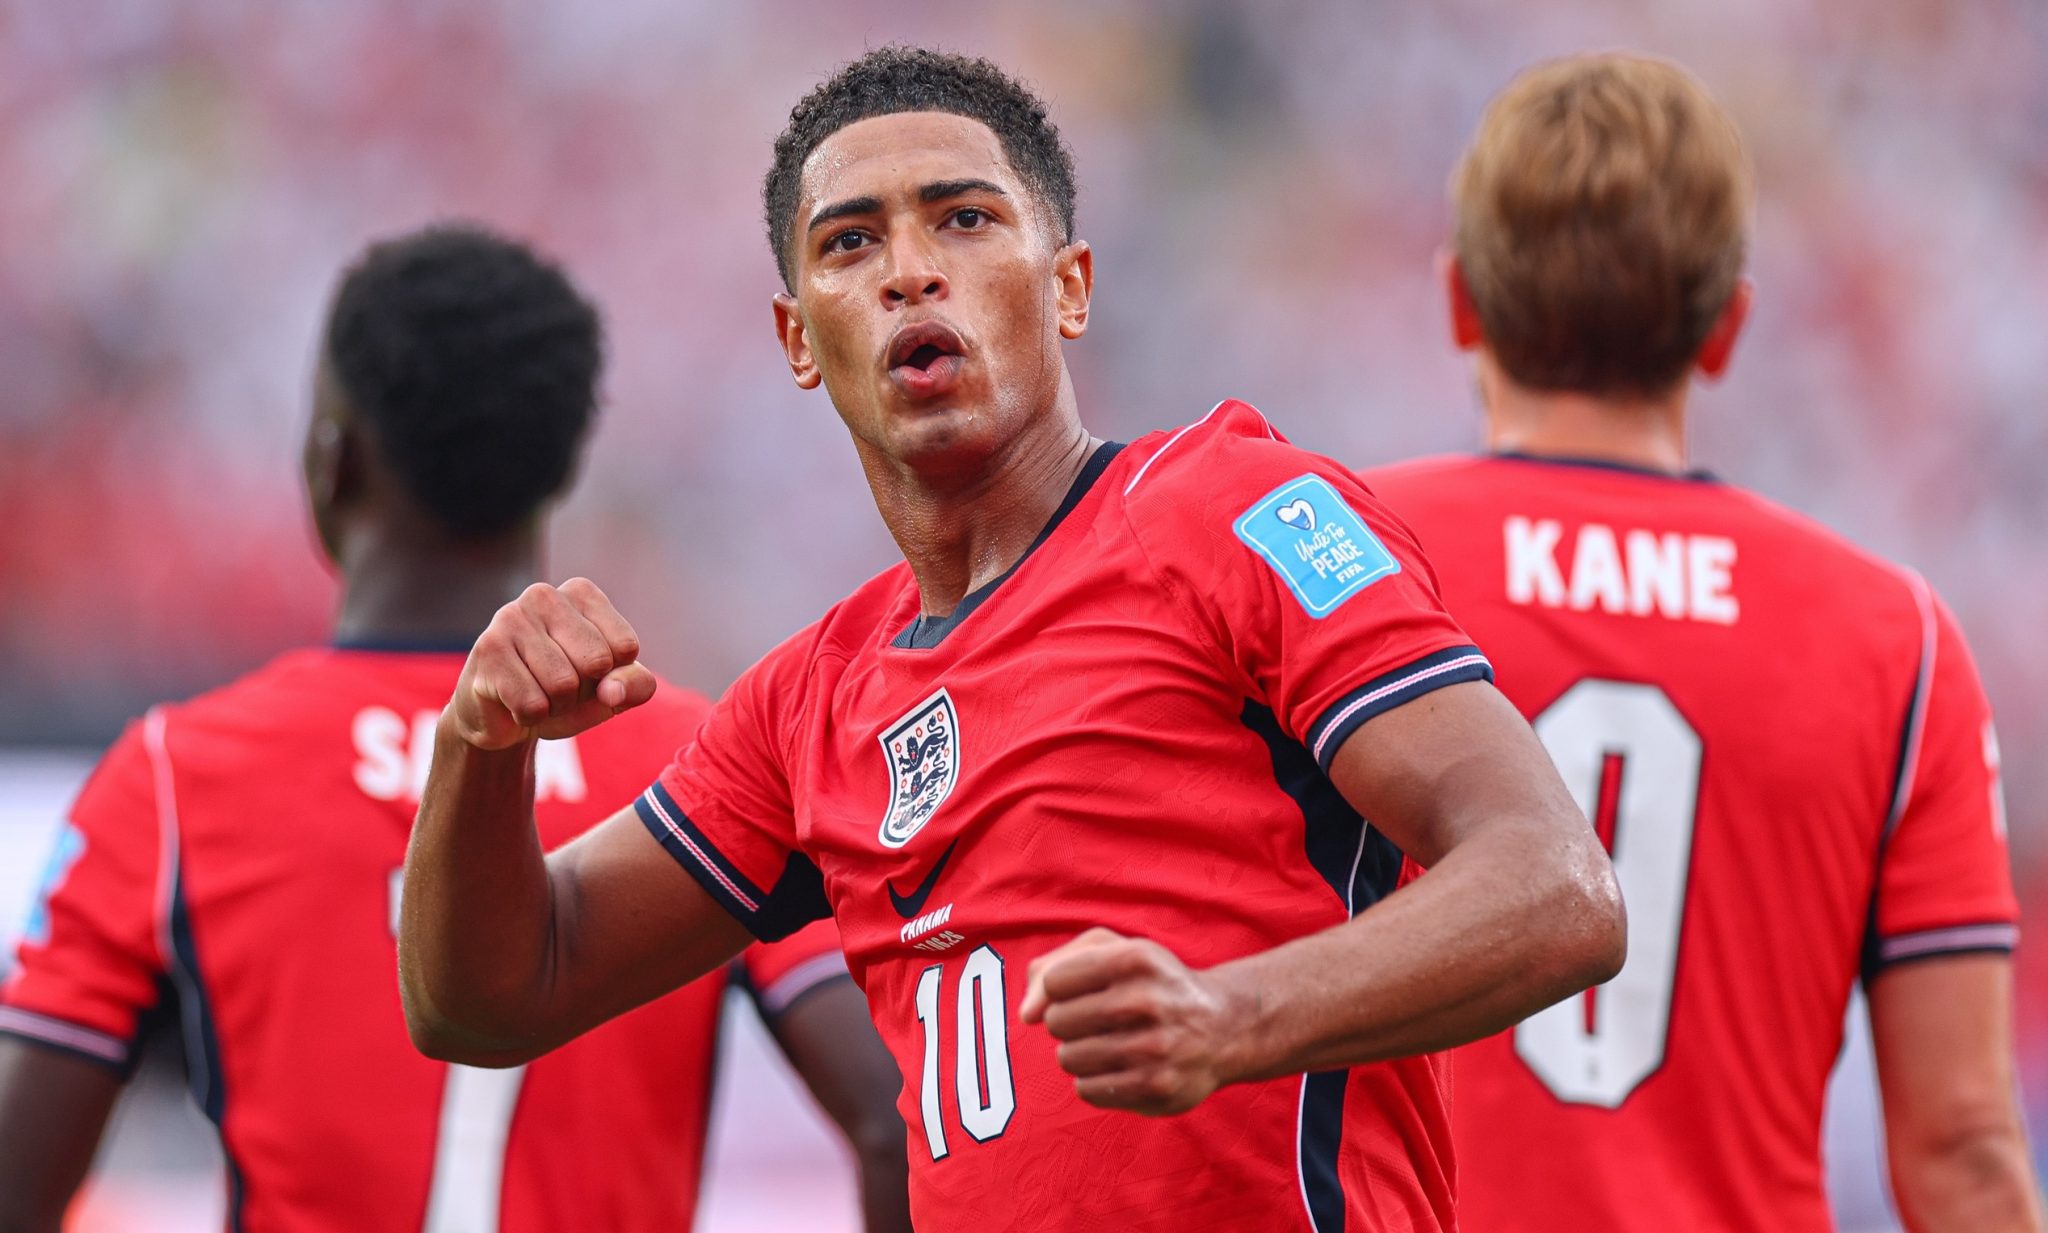
England vs. DR Congo Round of 32 Prediction: FIFA World Cup Odds, Betting Picks
England opens their knockout campaign on Wednesday at Atalanta Stadium against DR Congo in the Round of 32.
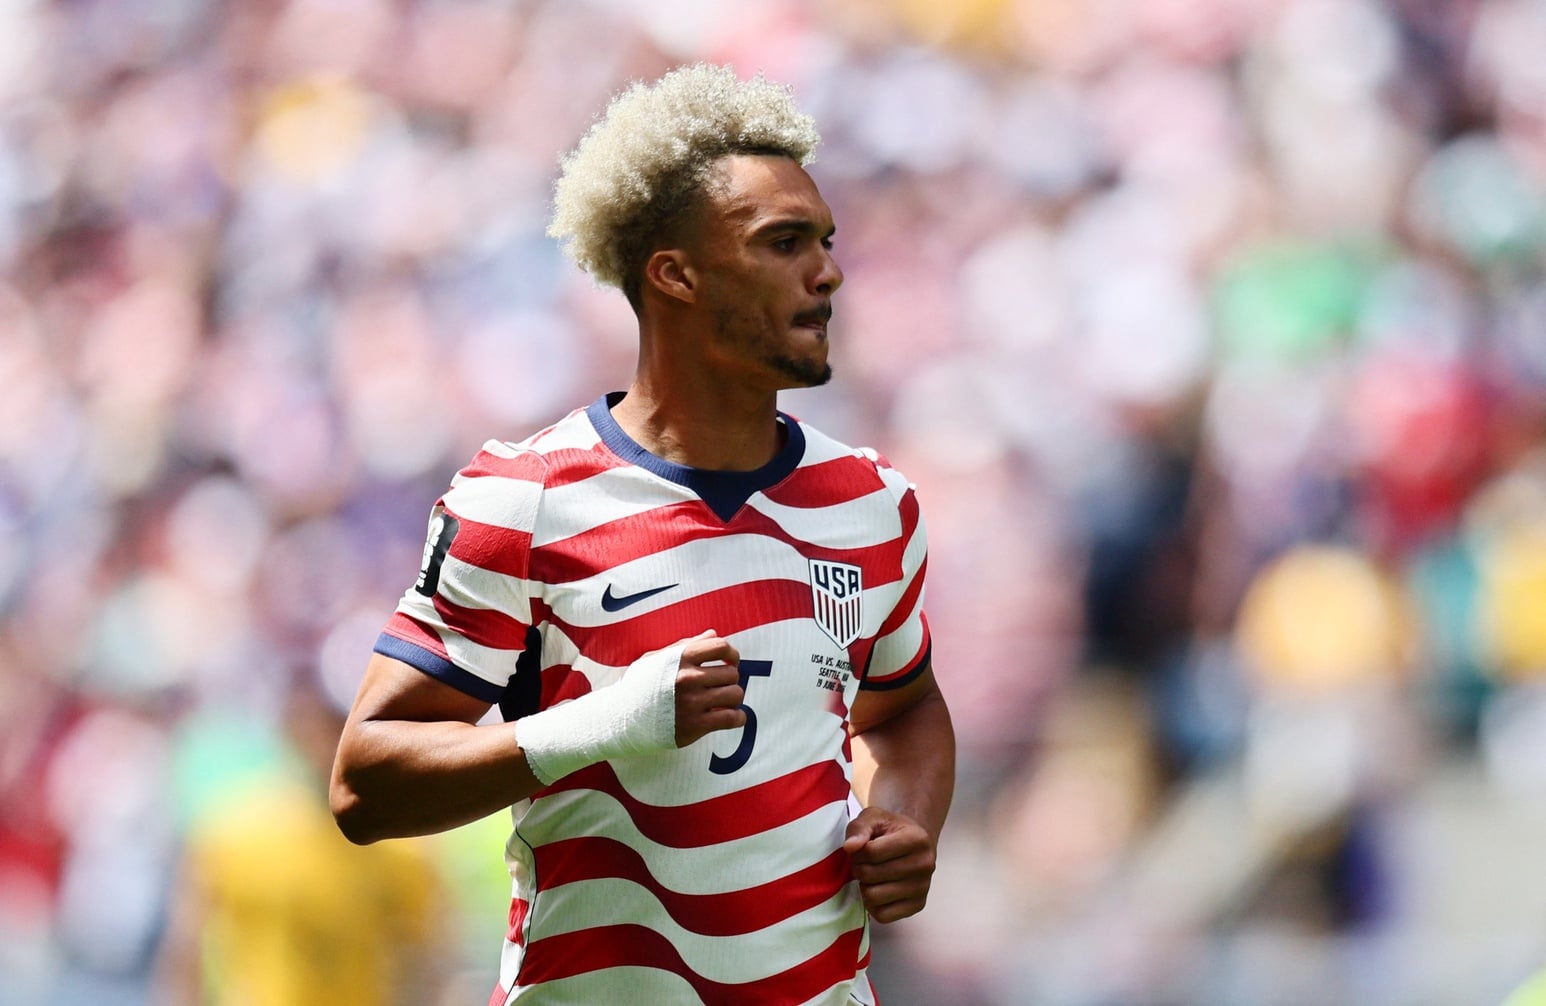
USA vs. Bosnia and Herzegovina Round of 32 Prediction: FIFA World Cup Odds, Betting Picks
The United States looks for its second-ever World Cup knockout round victory when it faces Bosnia & Herzegovina on Wednesday night from outside San Francisco for a spot in the last 16.
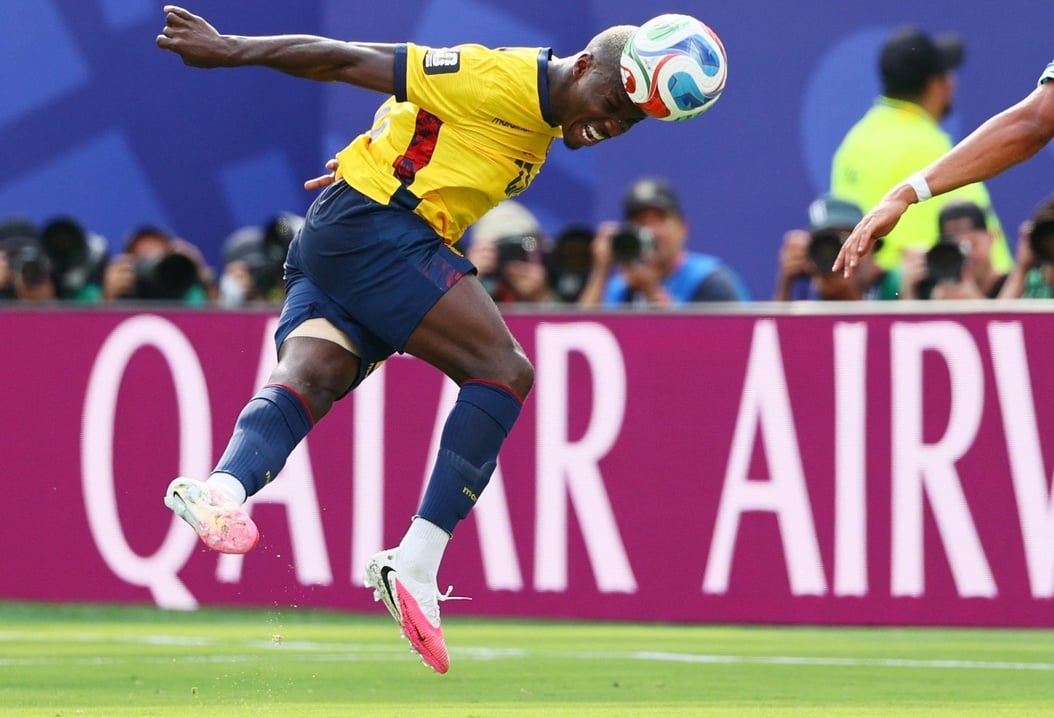
Mexico vs. Ecuador Round of 32 Prediction: FIFA World Cup Odds, Betting Picks
Ecuador look to build on their stunning 2-1 upset victory over Germany that earned them a berth in the World Cup knockout stage when they take on Mexico in round of 32 betting action at Mexico City Stadium.
FIFA World Cup Day 20 Betting Parlay Picks: Mexico look to remain unbeaten
The World Cup’s first-ever Round of 32 knockout stage continues with three more matches on Tuesday.

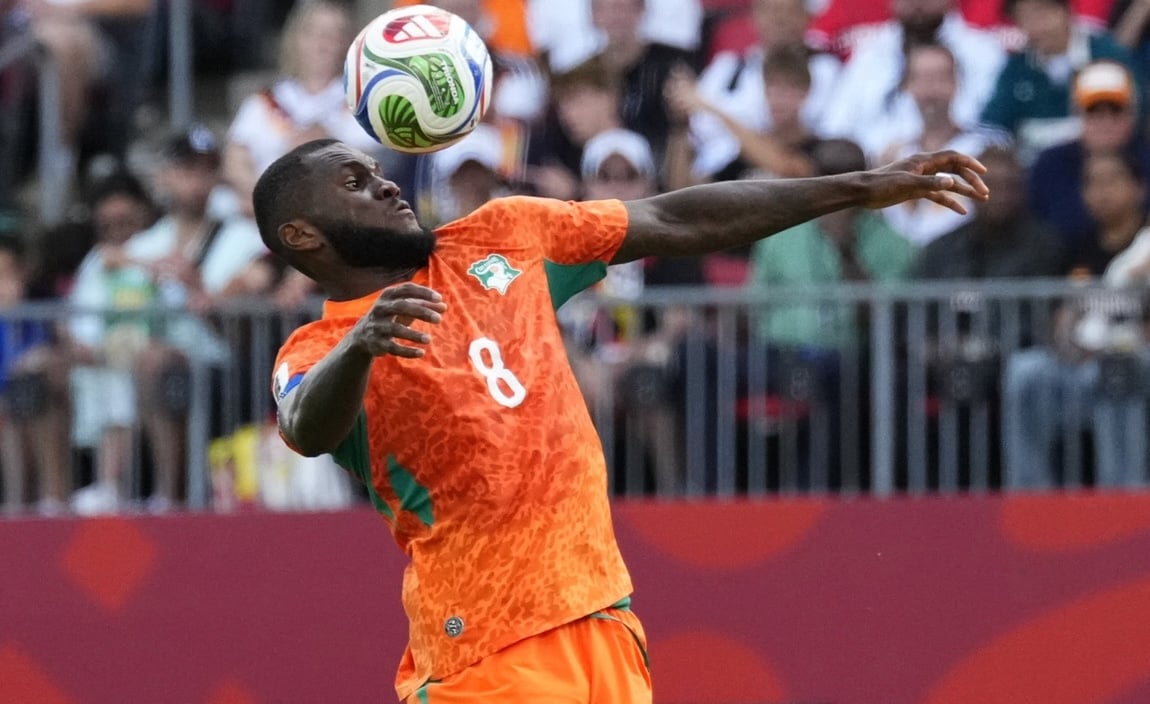
Ivory Coast vs. Norway Prediction: FIFA World Cup Odds, Betting Picks
The 2026 World Cup Round of 32 rolls into AT&T Stadium in Arlington on Tuesday when the Ivory Coast face Norway.
Report: Raptors closing deal with Clippers to send Kawhi Leonard back to Toronto
Wimbledon second round preview and predictions, featuring Felix Auger-Aliassime and Novak Djokovic
2026 NHL Free Agency Preview, Top Targets and Rumours
Belgium vs. Senegal Round of 32 Prediction: FIFA World Cup Odds, Betting Picks
-
Detroit Tigers vs. New York Yankees: Odds, Prediction
England vs. DR Congo Round of 32 Prediction: FIFA World Cup Odds, Betting Picks
USA vs. Bosnia and Herzegovina Round of 32 Prediction: FIFA World Cup Odds, Betting Picks
Mexico vs. Ecuador Round of 32 Prediction: FIFA World Cup Odds, Betting Picks
FIFA World Cup Day 20 Betting Parlay Picks: Mexico look to remain unbeaten
Ivory Coast vs. Norway Prediction: FIFA World Cup Odds, Betting Picks


