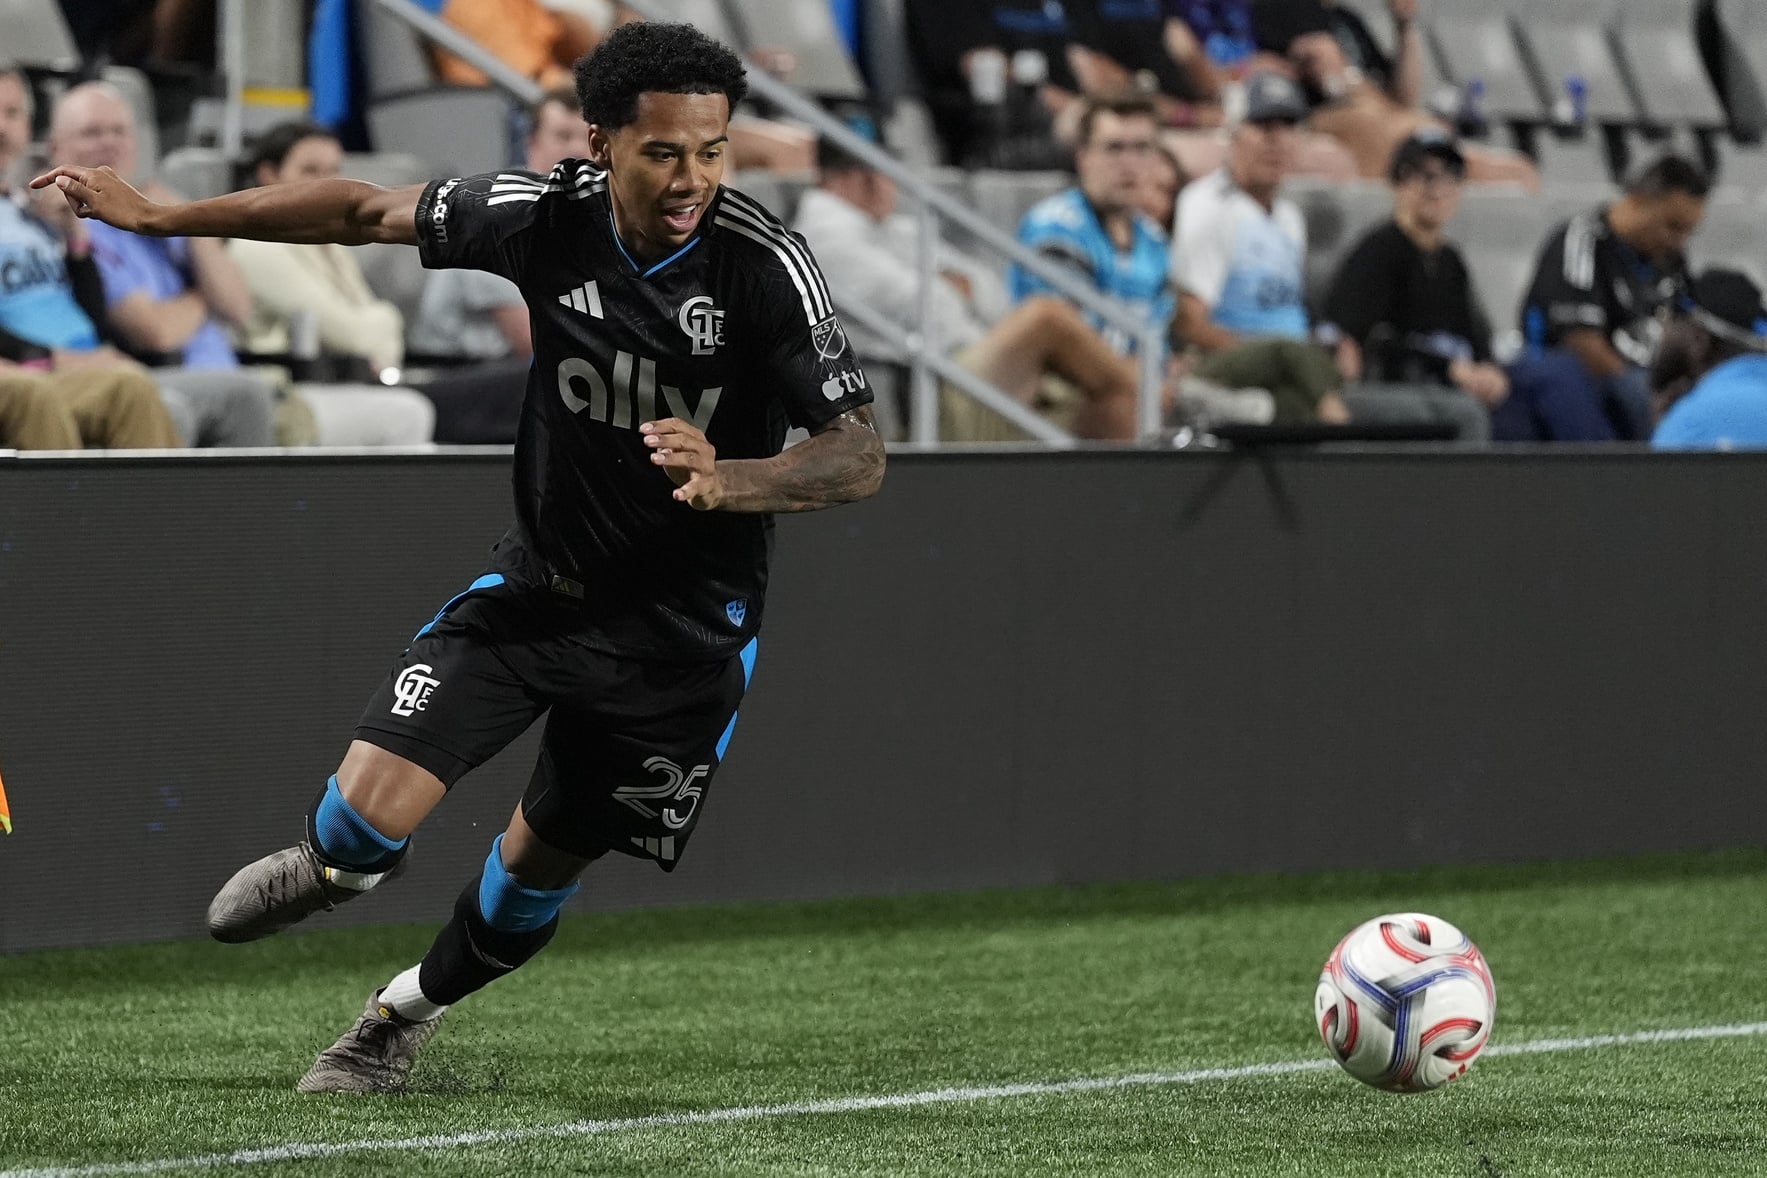
Charlotte FC vs. Toronto FC MLS Preview and Prediction
Ninth plays 10th in an Eastern Conference dogfight when Charlotte FC hosts Toronto FC on Saturday.
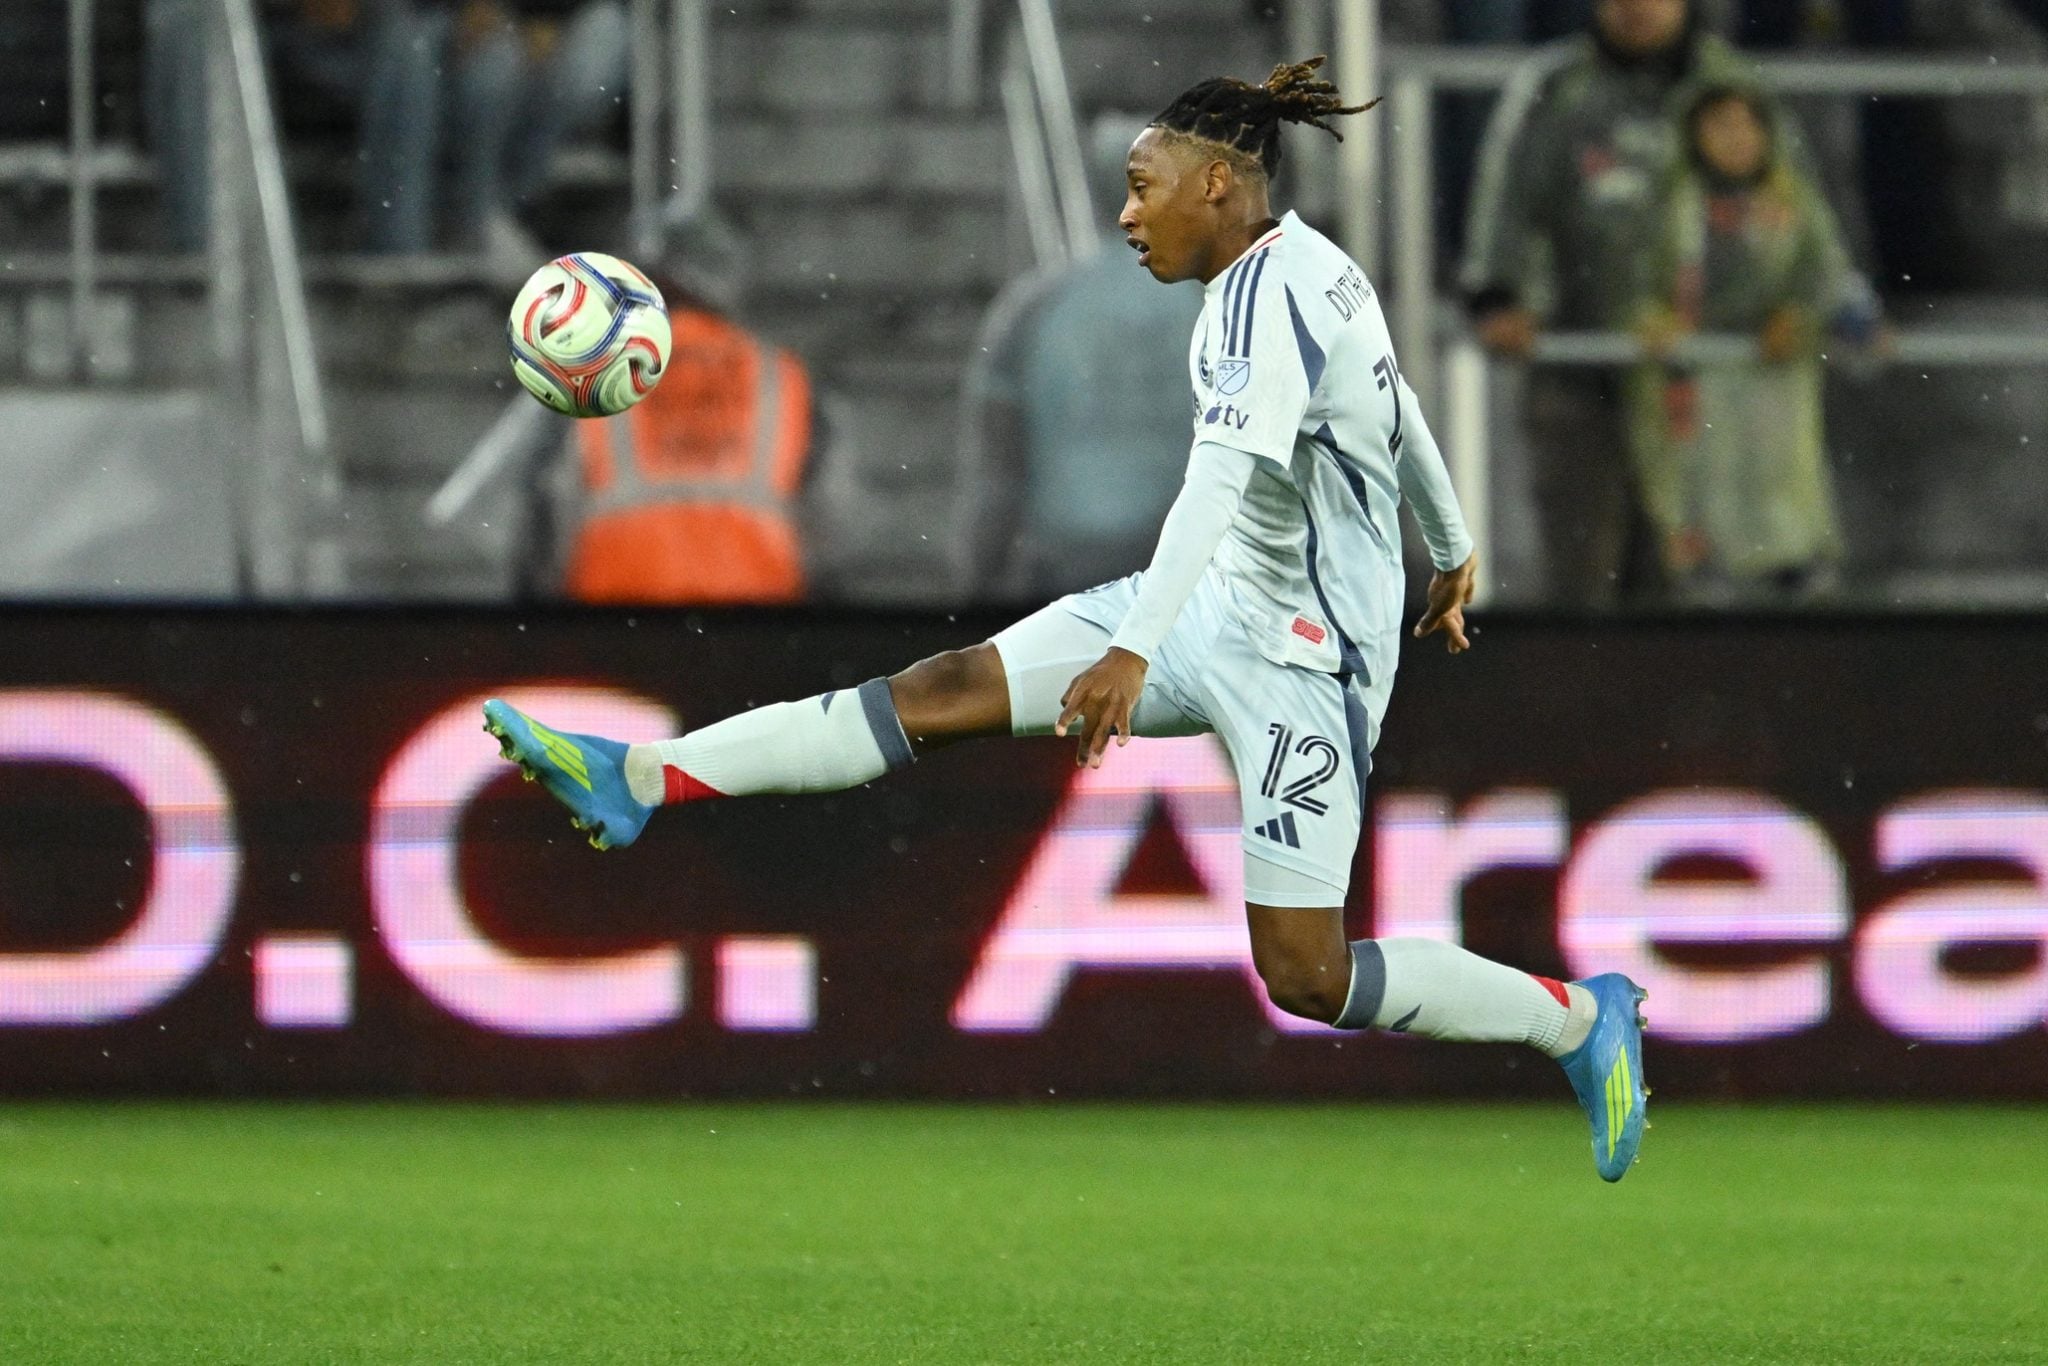
CF Montreal vs. Chicago Fire MLS Preview and Prediction
Another Eastern Conference brawl takes off this weekend between the Chicago Fire and CF Montreal.
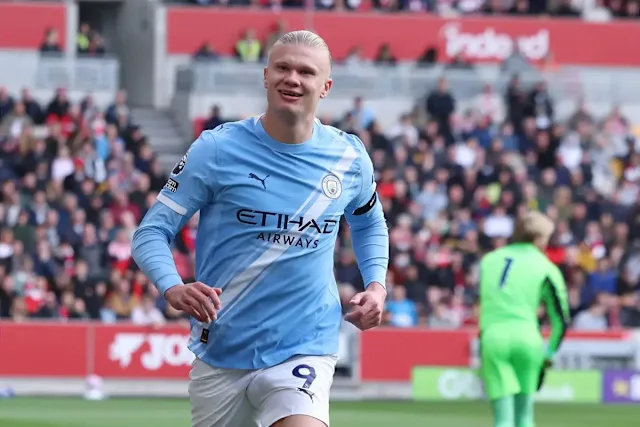
EPL Soccer Picks, Predictions, Best Bets: Erling Haaland closing in on third Premier League Golden Boot
English football hits the turf with just two more weeks remaining to determine a 2026 champion.
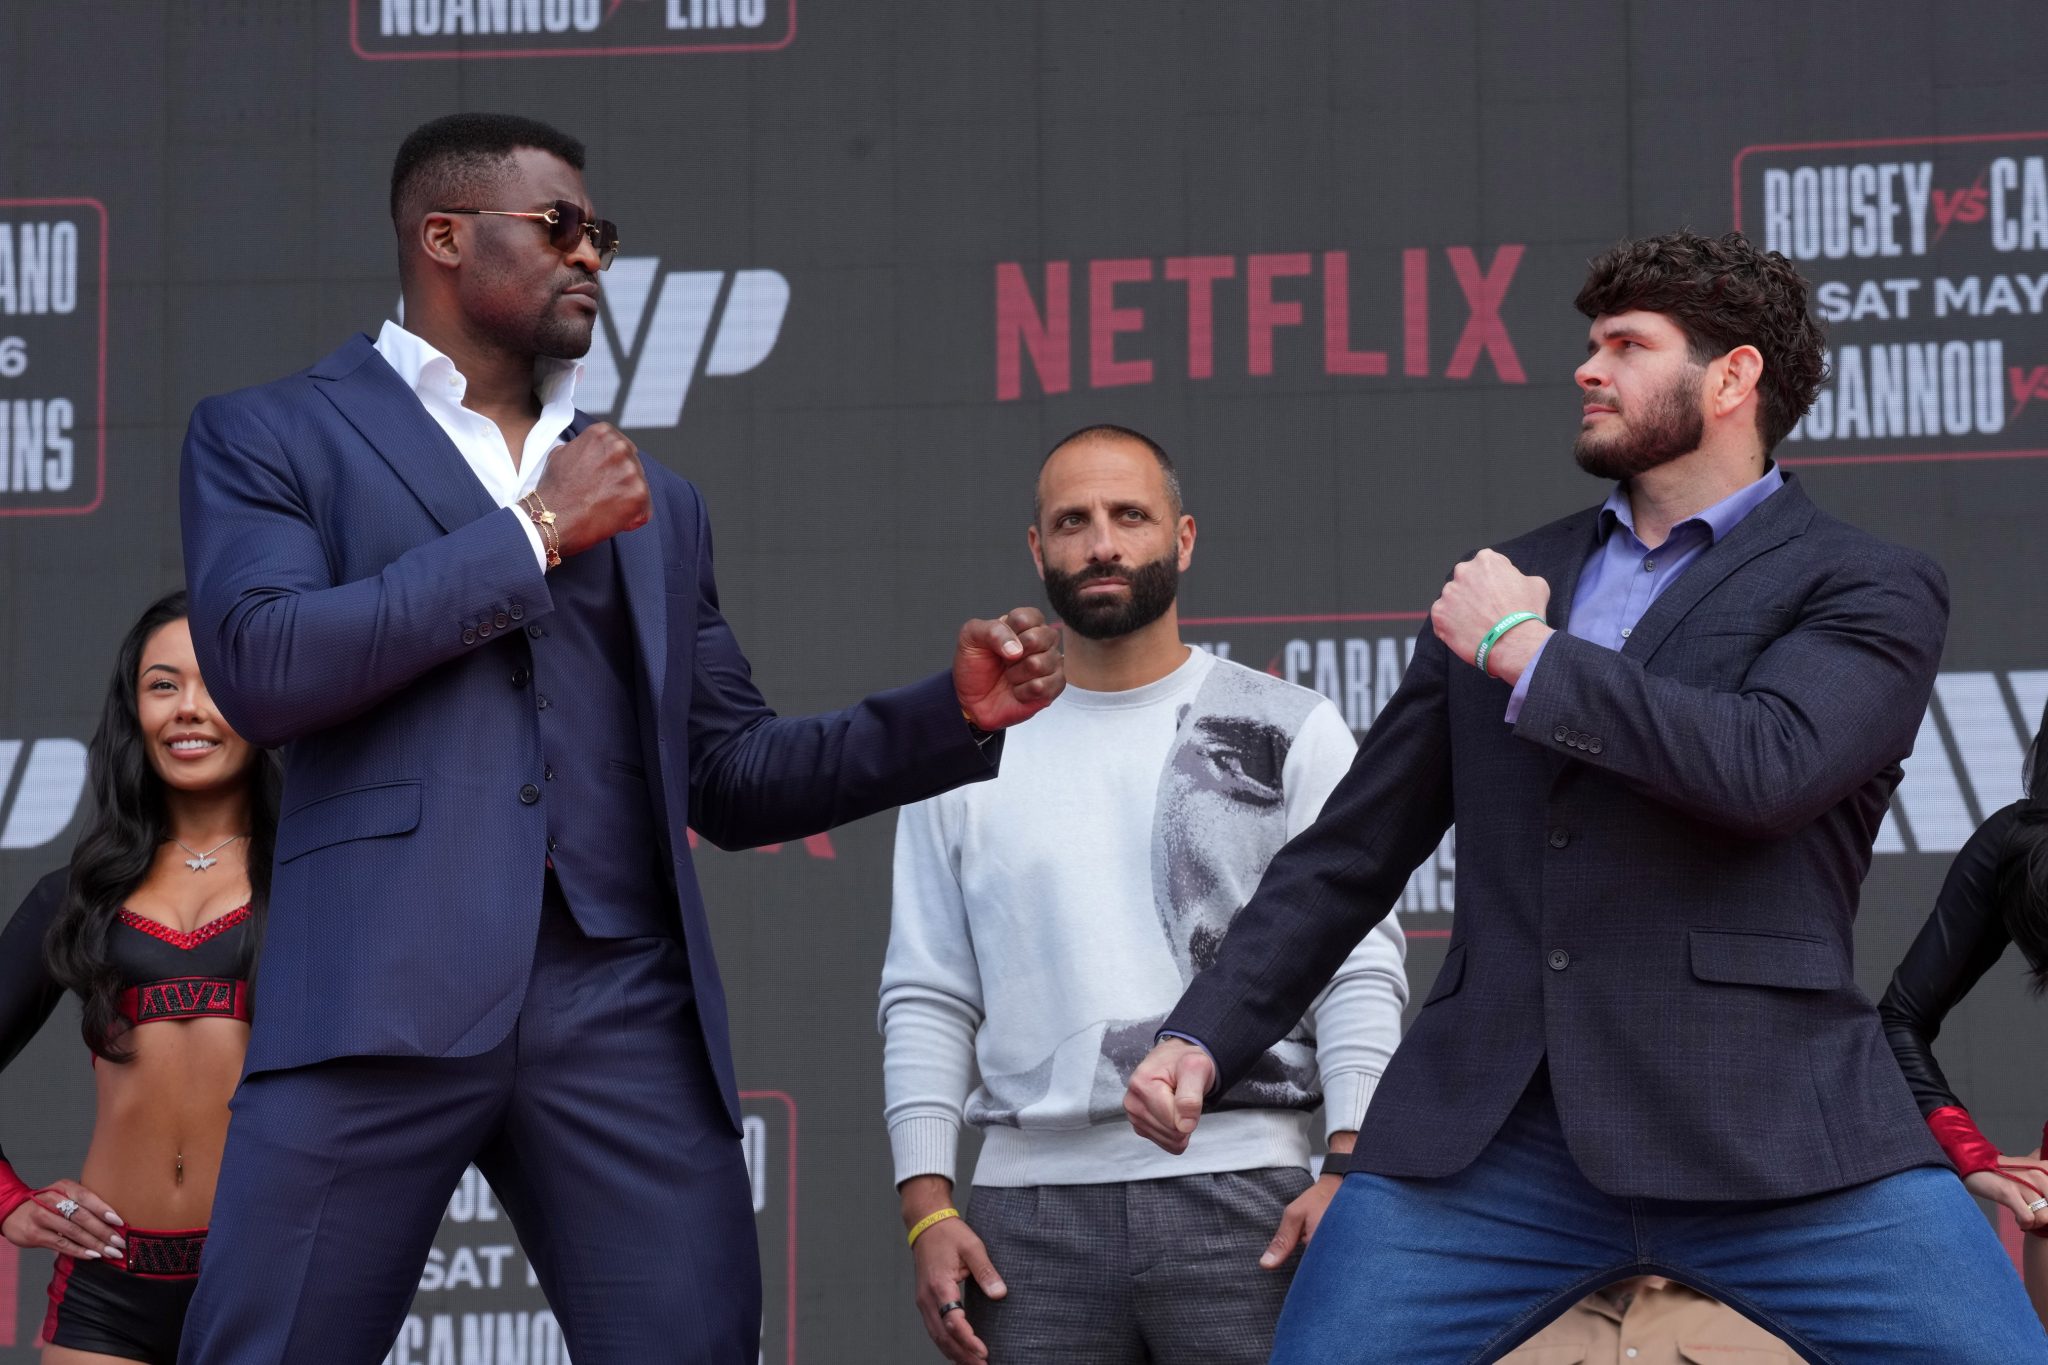
Francis Ngannou vs. Philipe Lins: MVP MMA 1 Odds, Prediction
Former UFC heavyweight champion Francis Ngannou will fight for the first time in over 18 months when he steps into the cage to face Philipe Lins on Saturday night in the promotional debut of MVP MMA at Intuit Dome in Los Angeles.
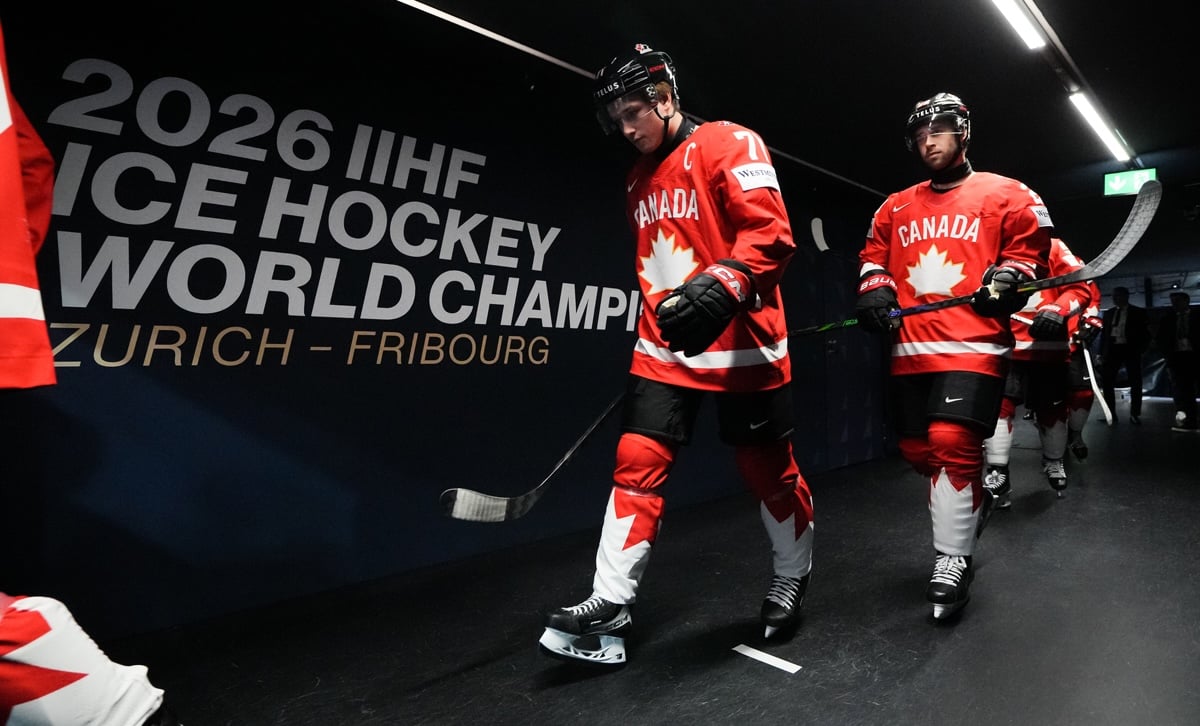
2026 IIHF Men’s World Championship Odds, Prediction: Italy vs. Canada
Canada continues group play at the 2026 IIHF World Championship in Switzerland on Saturday morning against Italy.
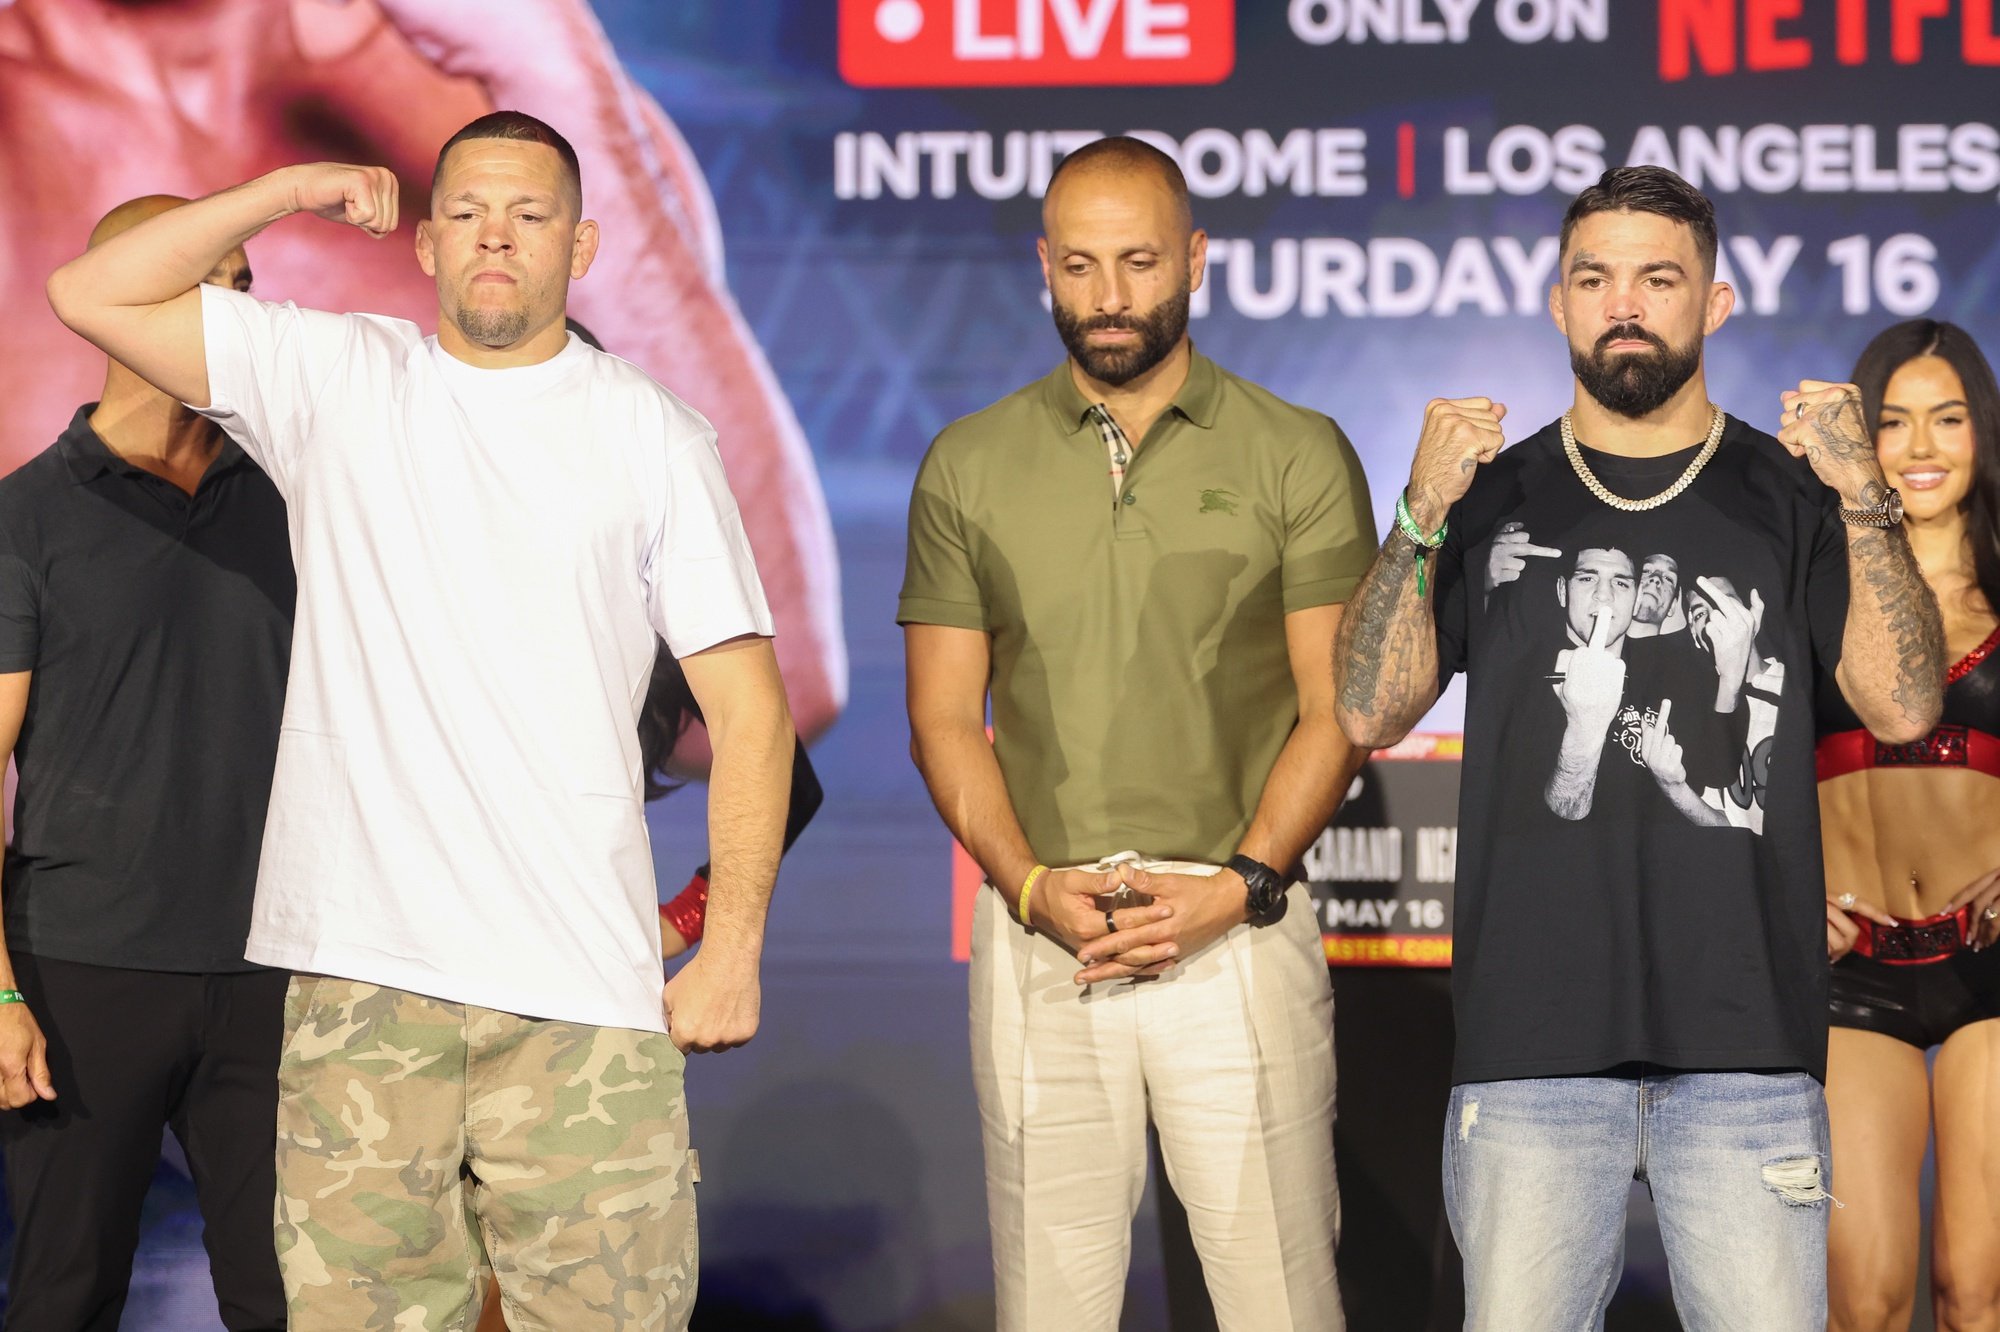
Nate Diaz vs. Mike Perry Fight Preview: MVP MMA 1 Odds, Prediction
Two legendary MMA fighters meet on Saturday night, with Nate Diaz and Mike Perry squaring off in a welterweight bout at the Intuit Dome in Los Angeles.
-
 Sports Interaction Staff
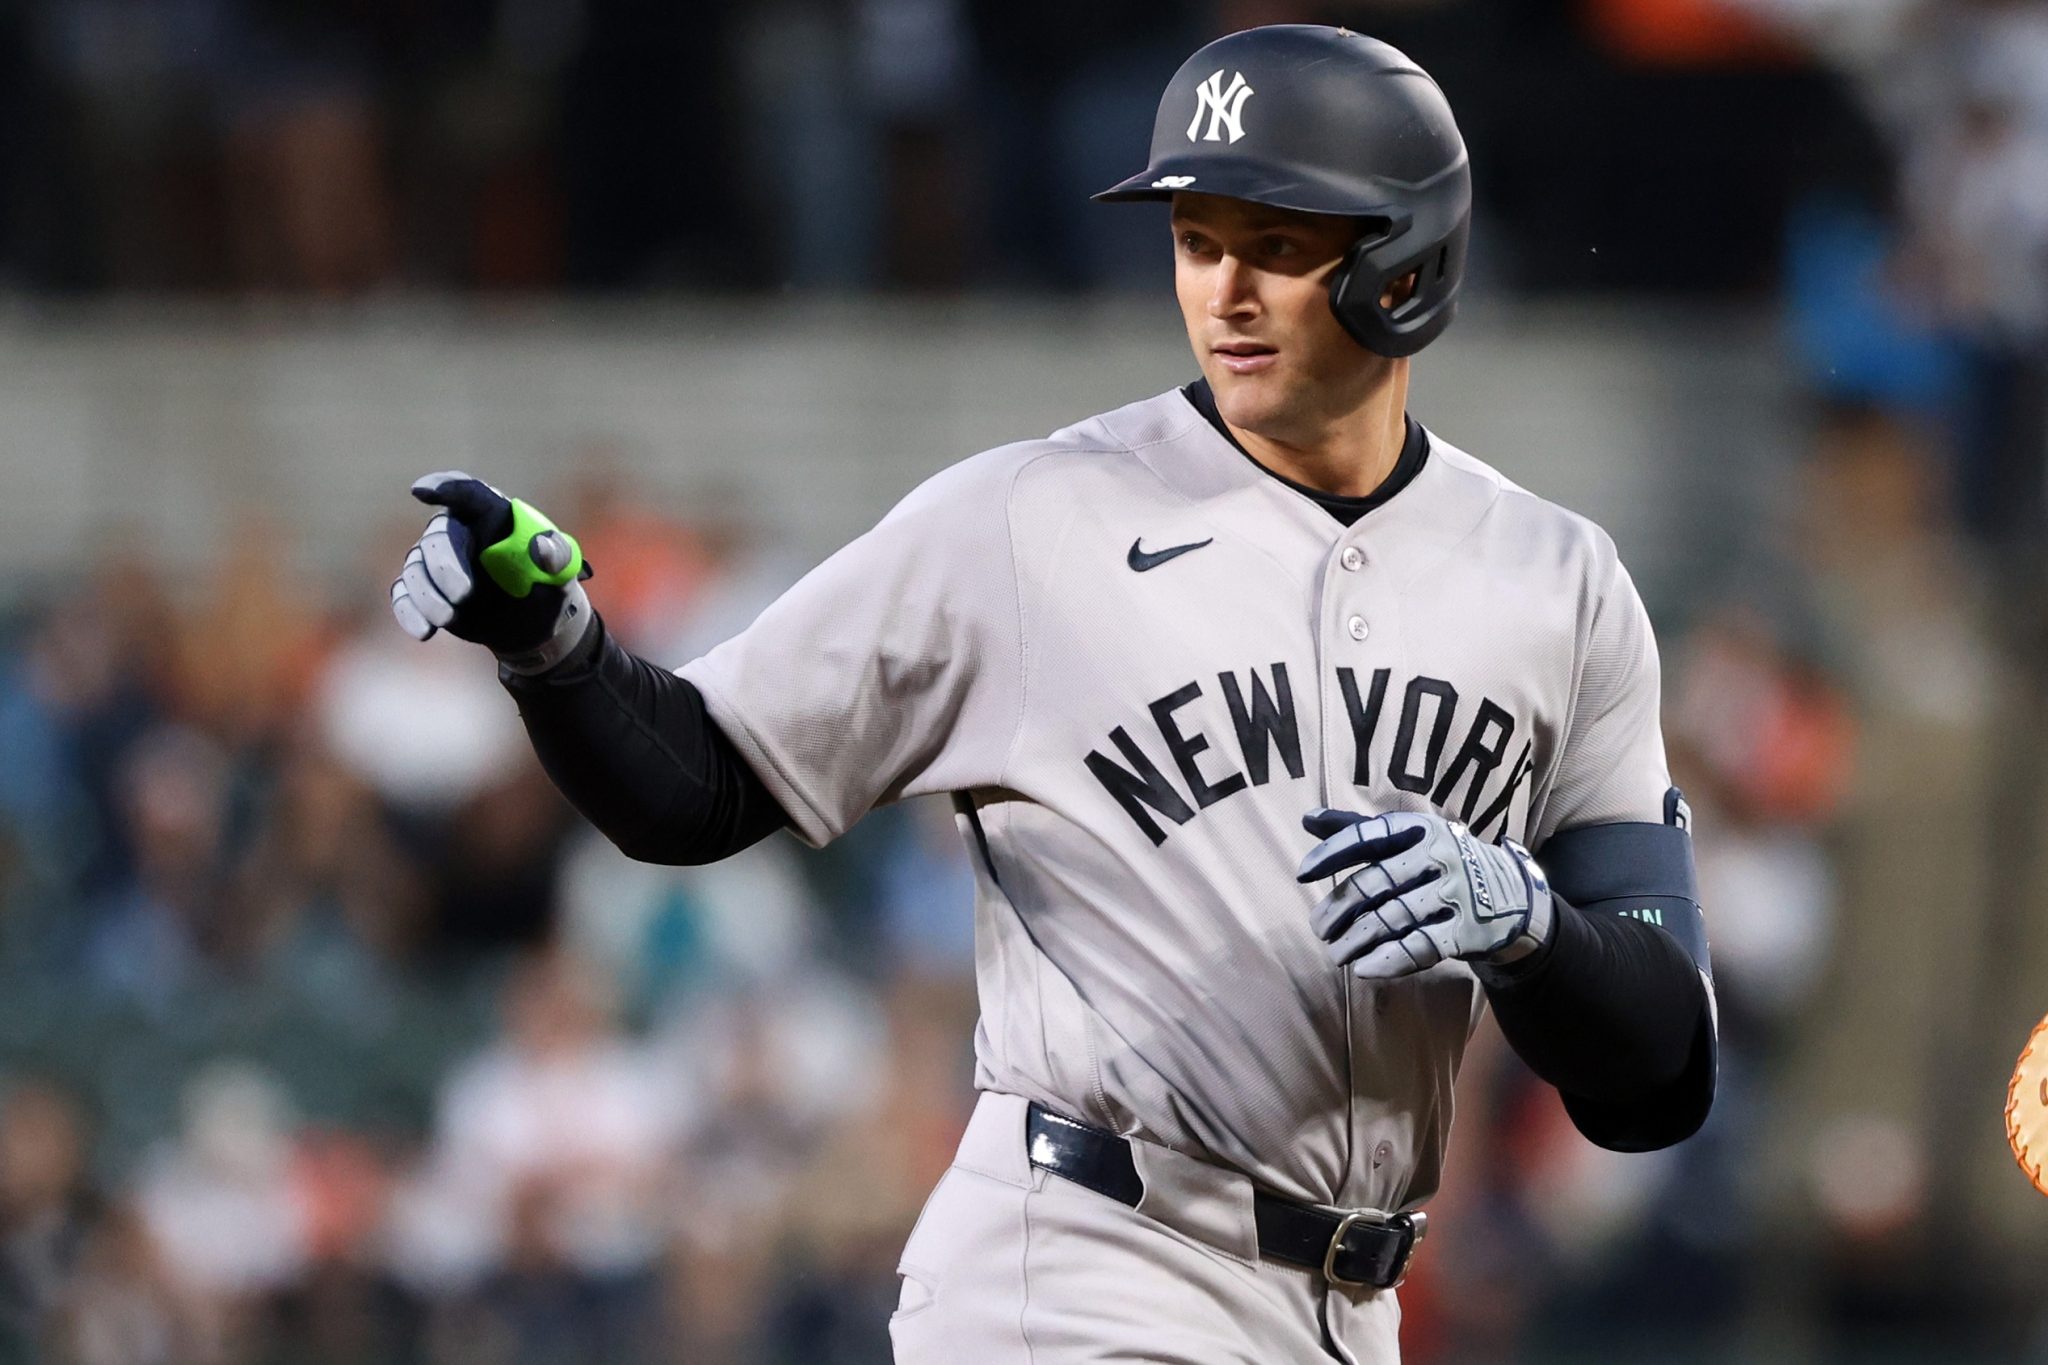
New York Yankees vs. New York Mets: Odds, Prediction
It’s the Subway Series between the New York Yankees and the New York Mets at Citi Field for this weekend’s three-game set.
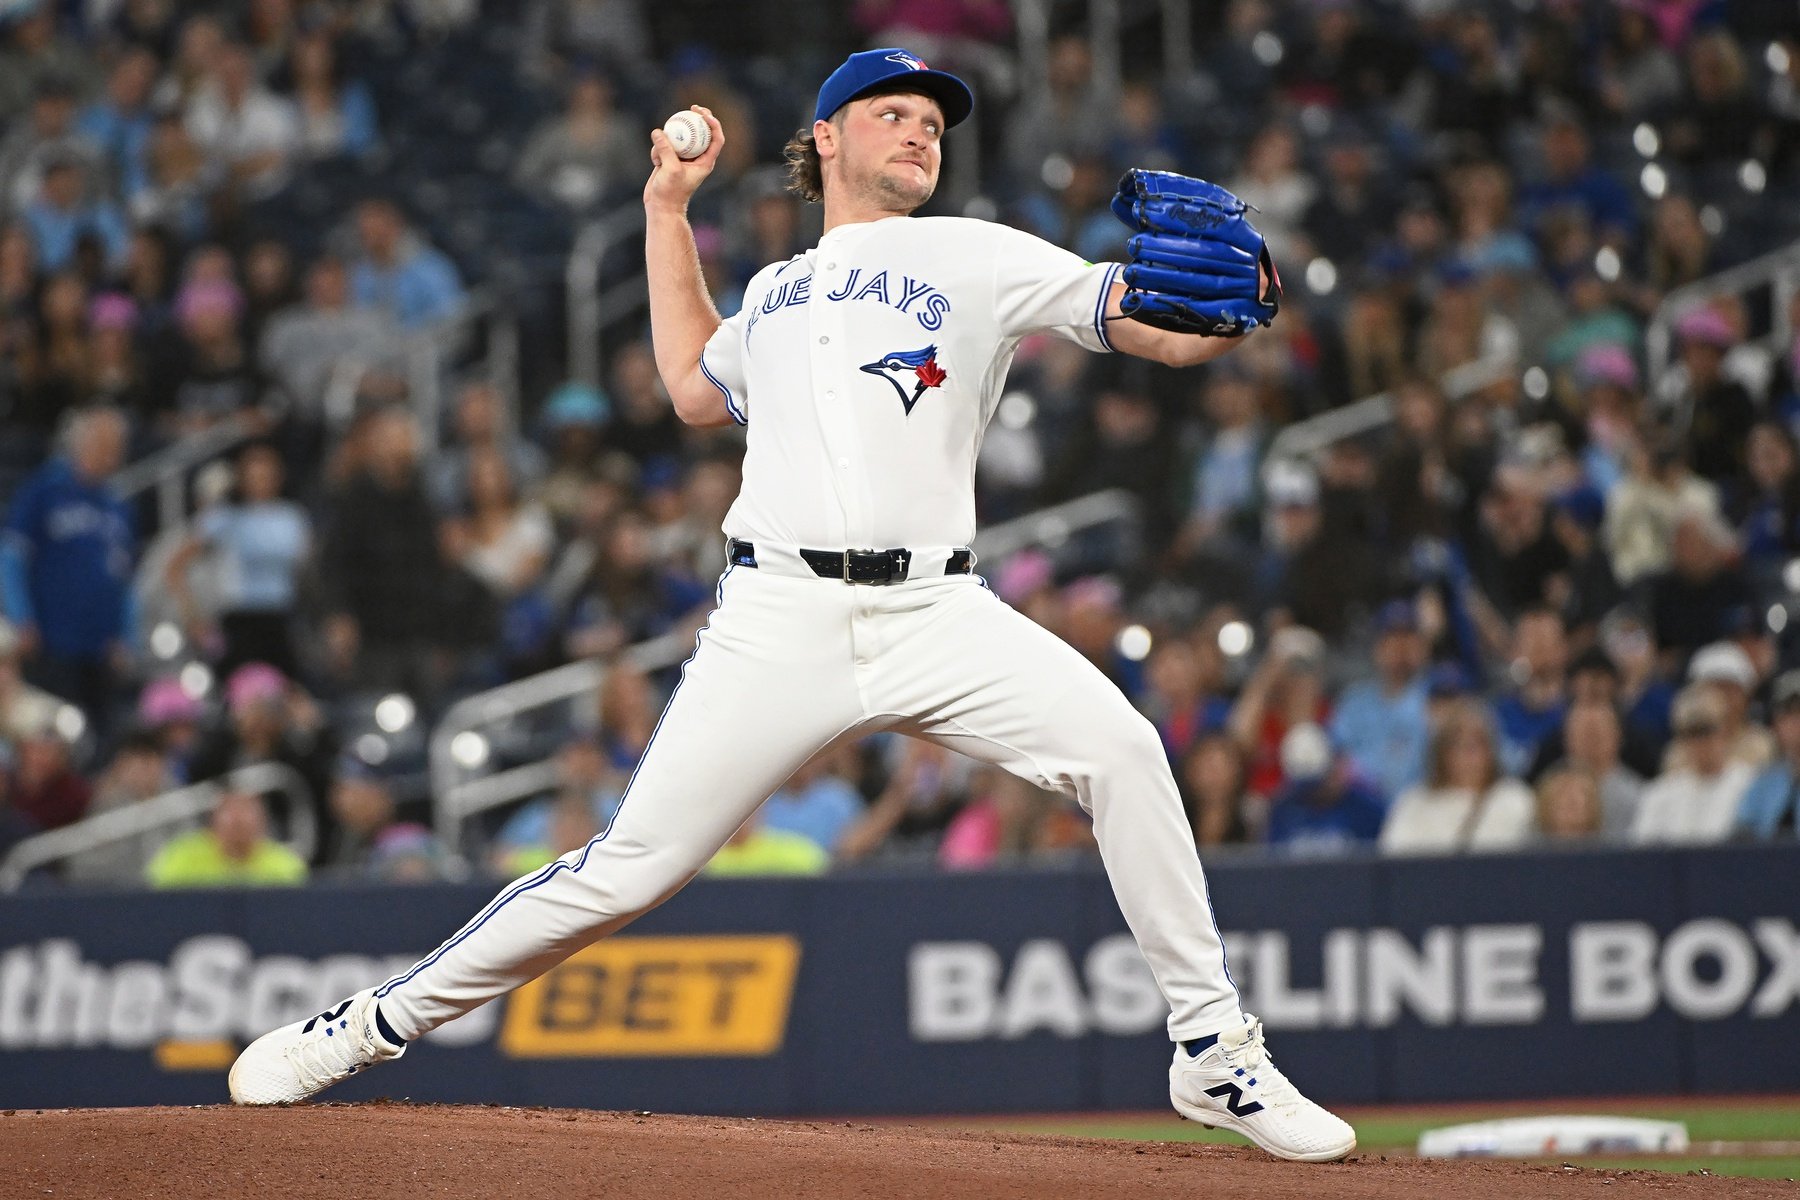
Toronto Blue Jays vs. Detroit Tigers: Odds, Prediction
The Blue Jays start a seven-game road trip against 2025 playoff teams on Friday night by making their only visit of the season to Detroit to kick off a three-game set.
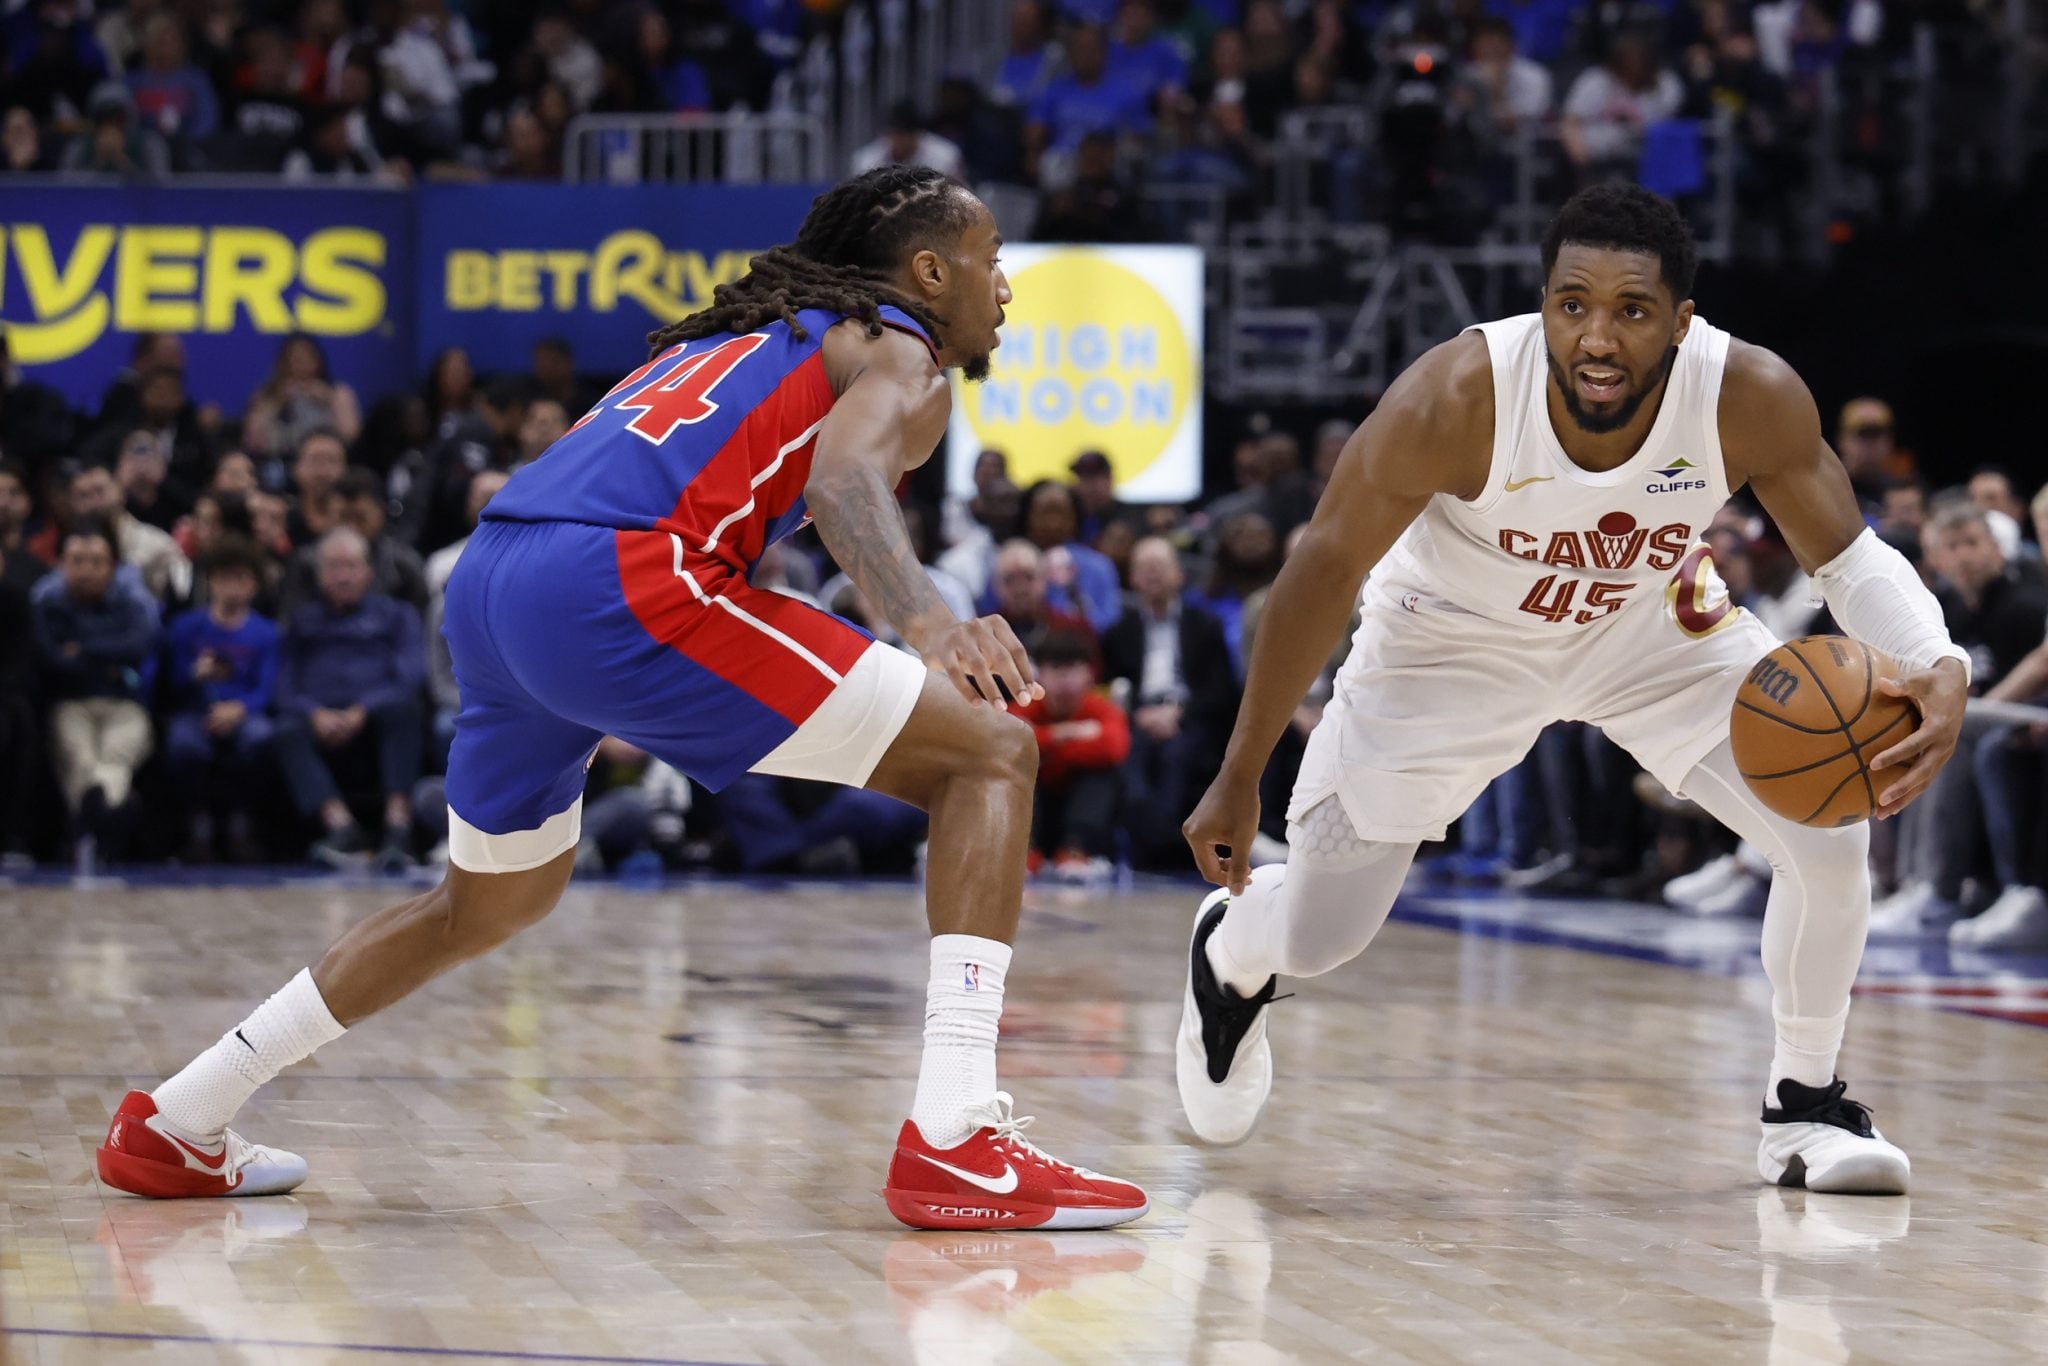
Detroit Pistons vs. Cleveland Cavaliers Game 6 Prediction, NBA Playoff Odds
The Eastern Conference semifinals have reached a fever pitch as the Cleveland Cavaliers look to close out the Detroit Pistons at Rocket Mortgage FieldHouse on Friday.
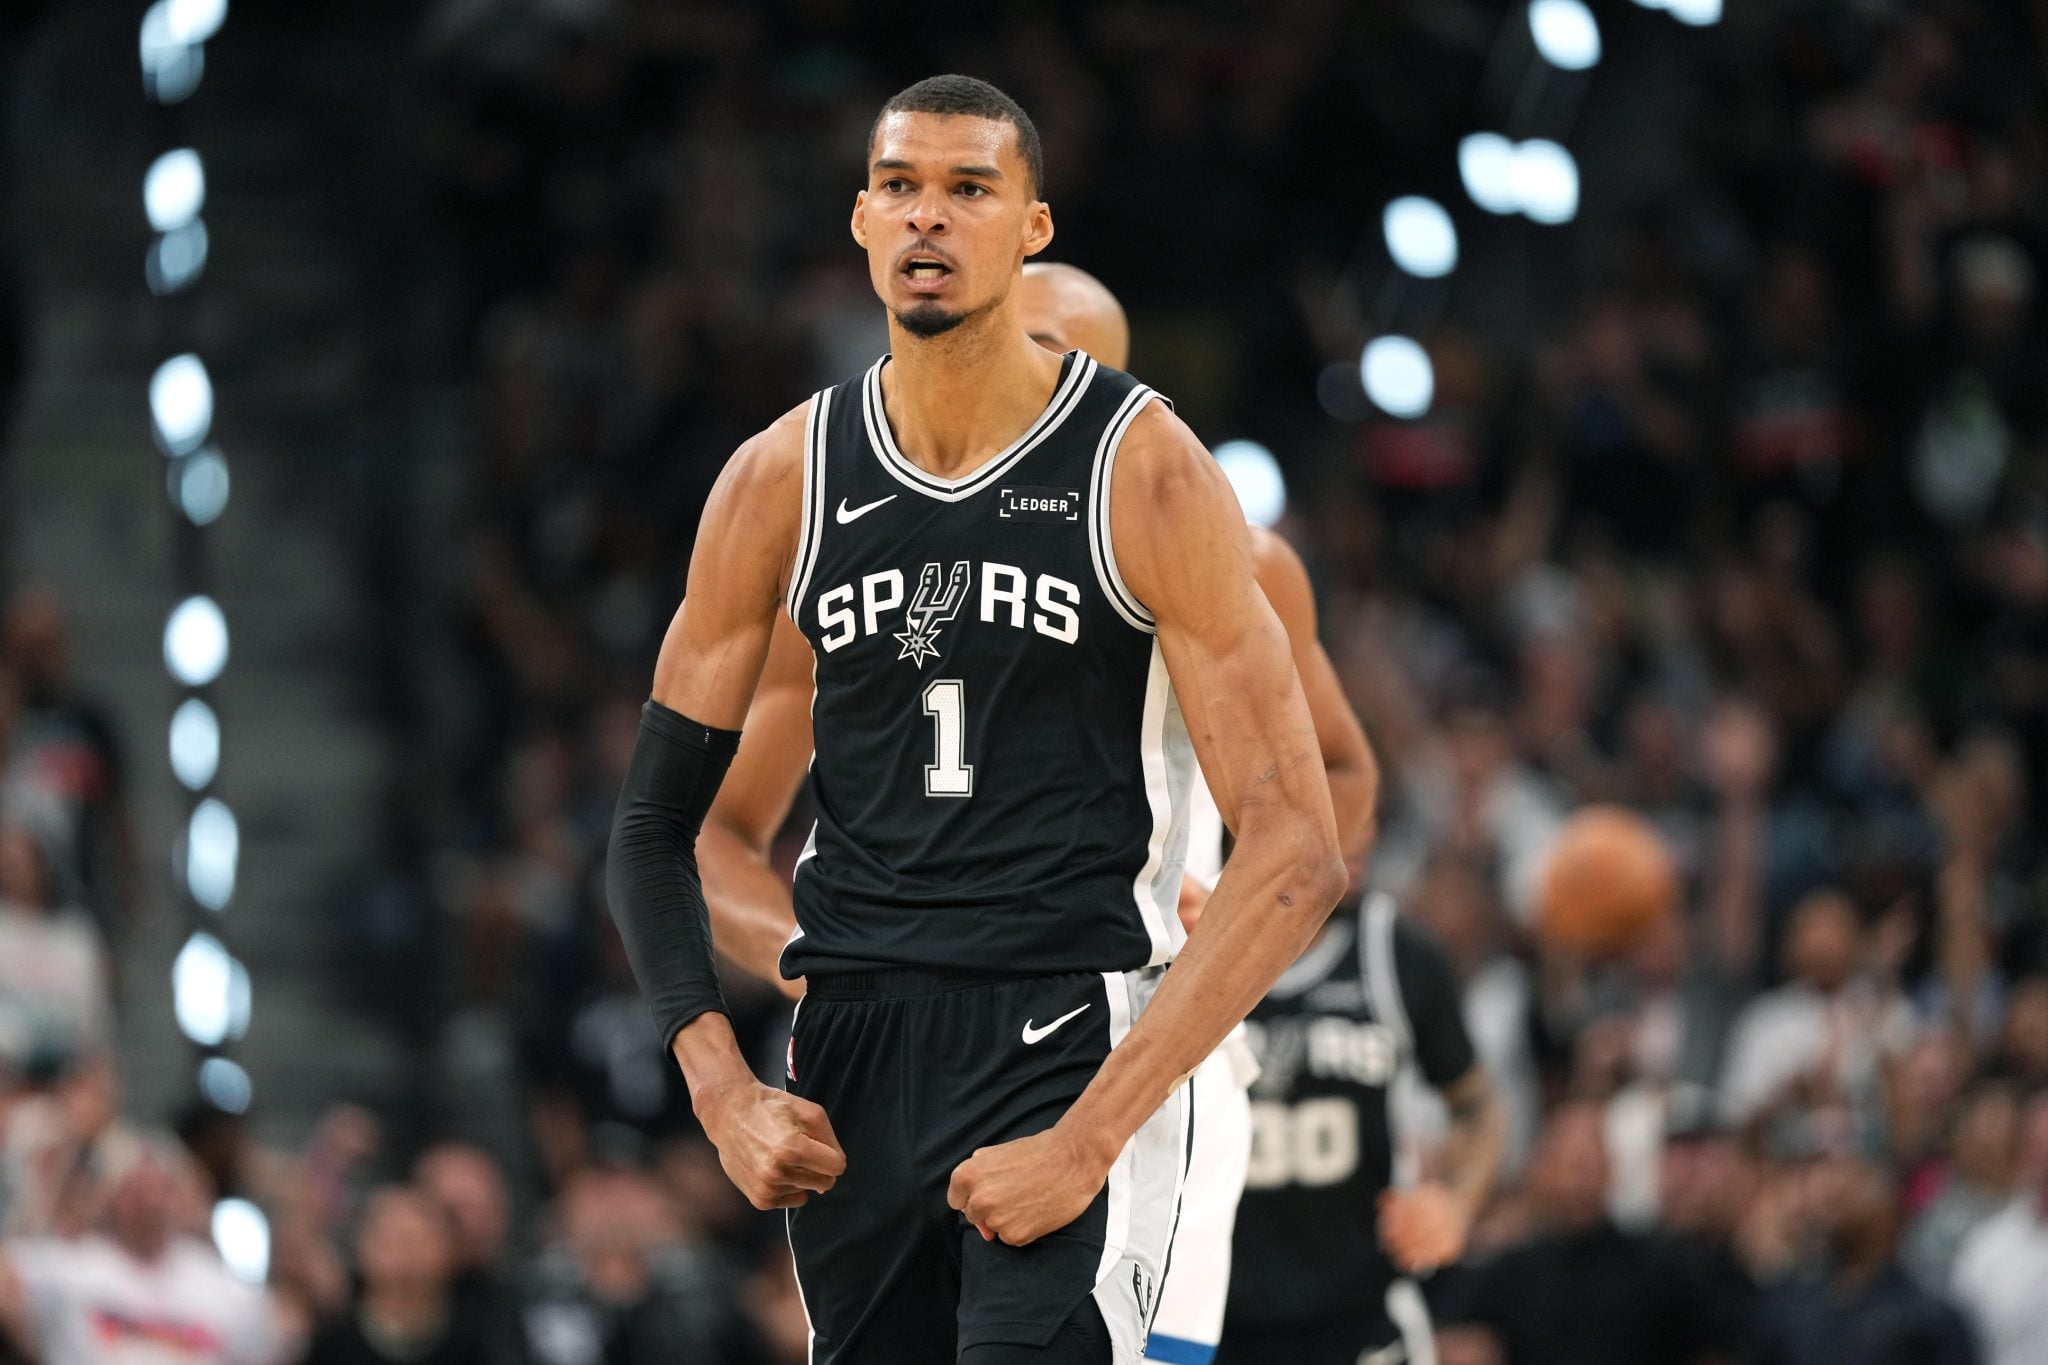
San Antonio Spurs vs. Minnesota Timberwolves Game 6 Prediction, NBA Playoff Odds
The San Antonio Spurs arrive at the Target Center on Friday night with a singular objective: finish the job.
Charlotte FC vs. Toronto FC MLS Preview and Prediction
CF Montreal vs. Chicago Fire MLS Preview and Prediction
EPL Soccer Picks, Predictions, Best Bets: Erling Haaland closing in on third Premier League Golden Boot
Francis Ngannou vs. Philipe Lins: MVP MMA 1 Odds, Prediction
2026 IIHF Men’s World Championship Odds, Prediction: Italy vs. Canada
Nate Diaz vs. Mike Perry Fight Preview: MVP MMA 1 Odds, Prediction
-
Sports Interaction Staff
New York Yankees vs. New York Mets: Odds, Prediction
Toronto Blue Jays vs. Detroit Tigers: Odds, Prediction
Detroit Pistons vs. Cleveland Cavaliers Game 6 Prediction, NBA Playoff Odds
San Antonio Spurs vs. Minnesota Timberwolves Game 6 Prediction, NBA Playoff Odds


