Egypt vs. Iran Prediction: FIFA World Cup Odds, Betting Picks
Group G is still completely up for grabs as Egypt and Iran face off for Matchday 3 on Friday night.

New Zealand vs. Belgium Prediction: FIFA World Cup Odds, Betting Picks
The FIFA World Cup’s Group G standings are up in the air as New Zealand takes on Belgium in the final round of group stage play.

Cape Verde vs. Saudi Arabia Prediction: FIFA World Cup Odds, Betting Picks
Group H reaches its final chapter on Friday, June 26, when Cape Verde and Saudi Arabia meet at Houston Stadium in a match that could determine who advances to the knockout stage.

Uruguay vs. Spain Prediction: FIFA World Cup Odds, Betting Picks
Group H concludes on Friday, June 26, when Uruguay meets Spain at Estadio Akron in Guadalajara.

Los Angeles Sparks vs. Toronto Tempo WNBA preview and prediction
The Toronto Tempo will aim to get back to .500 on the season when they host the Los Angeles Sparks on Thursday.

Texas Rangers vs. Toronto Blue Jays: Odds, Prediction
The Blue Jays continue their Texas-themed week at Rogers Centre by hosting the Rangers on Thursday night to open a four-game series.

Roughriders vs. Argonauts Prediction: CFL Week 4 Point Spread, Odds
With the World Cup in Toronto, the Argonauts haven’t played a home game yet and will not until Week 10 vs. Calgary.

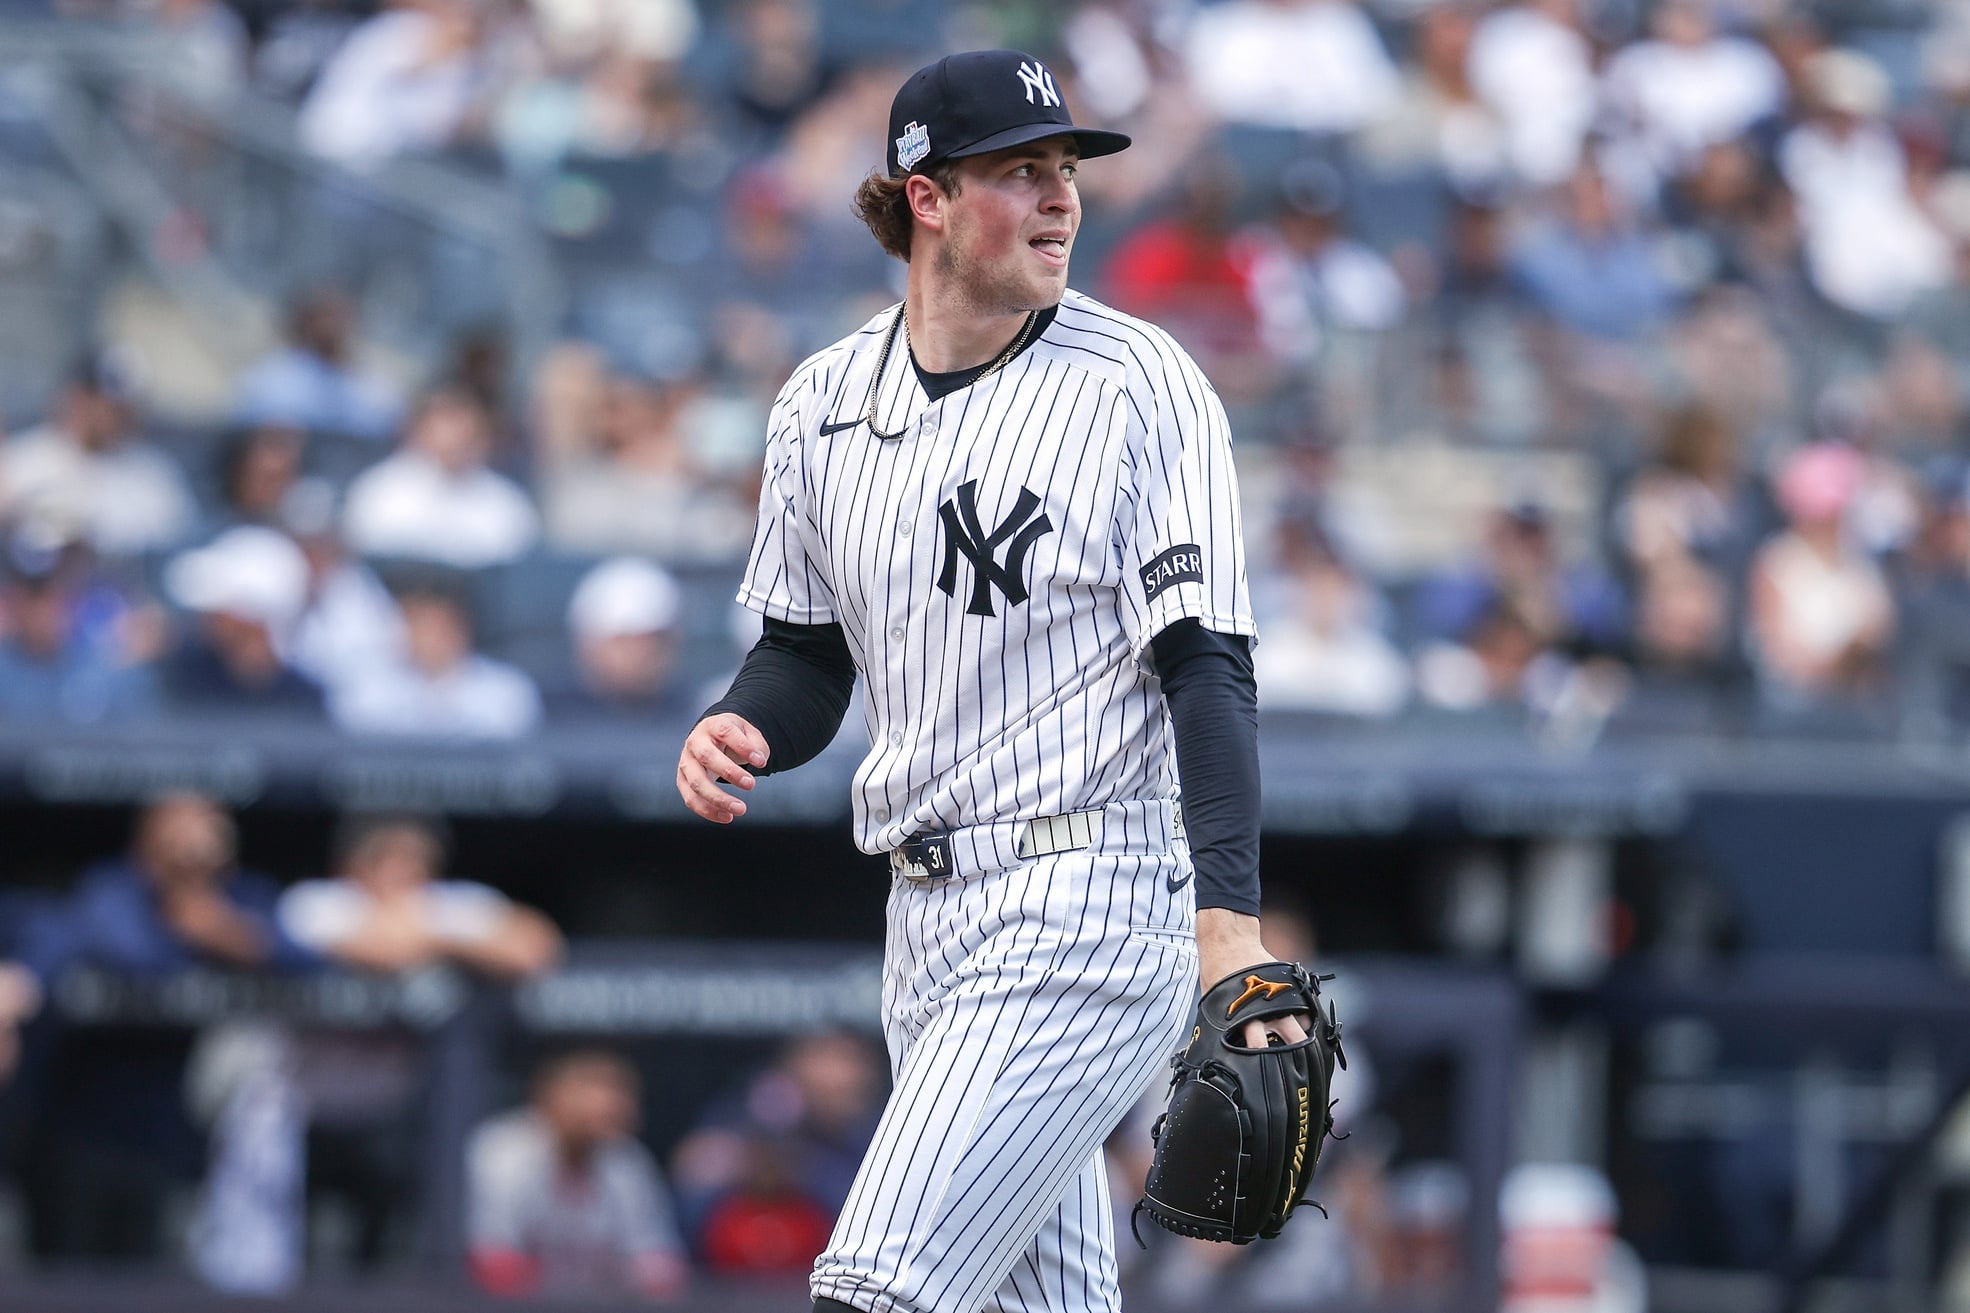
New York Yankees vs. Boston Red Sox: Odds, Prediction
The New York Yankees lead the season series against the Red Sox 4-1, outscoring Boston 21-9 overall and 12-3 at Fenway.
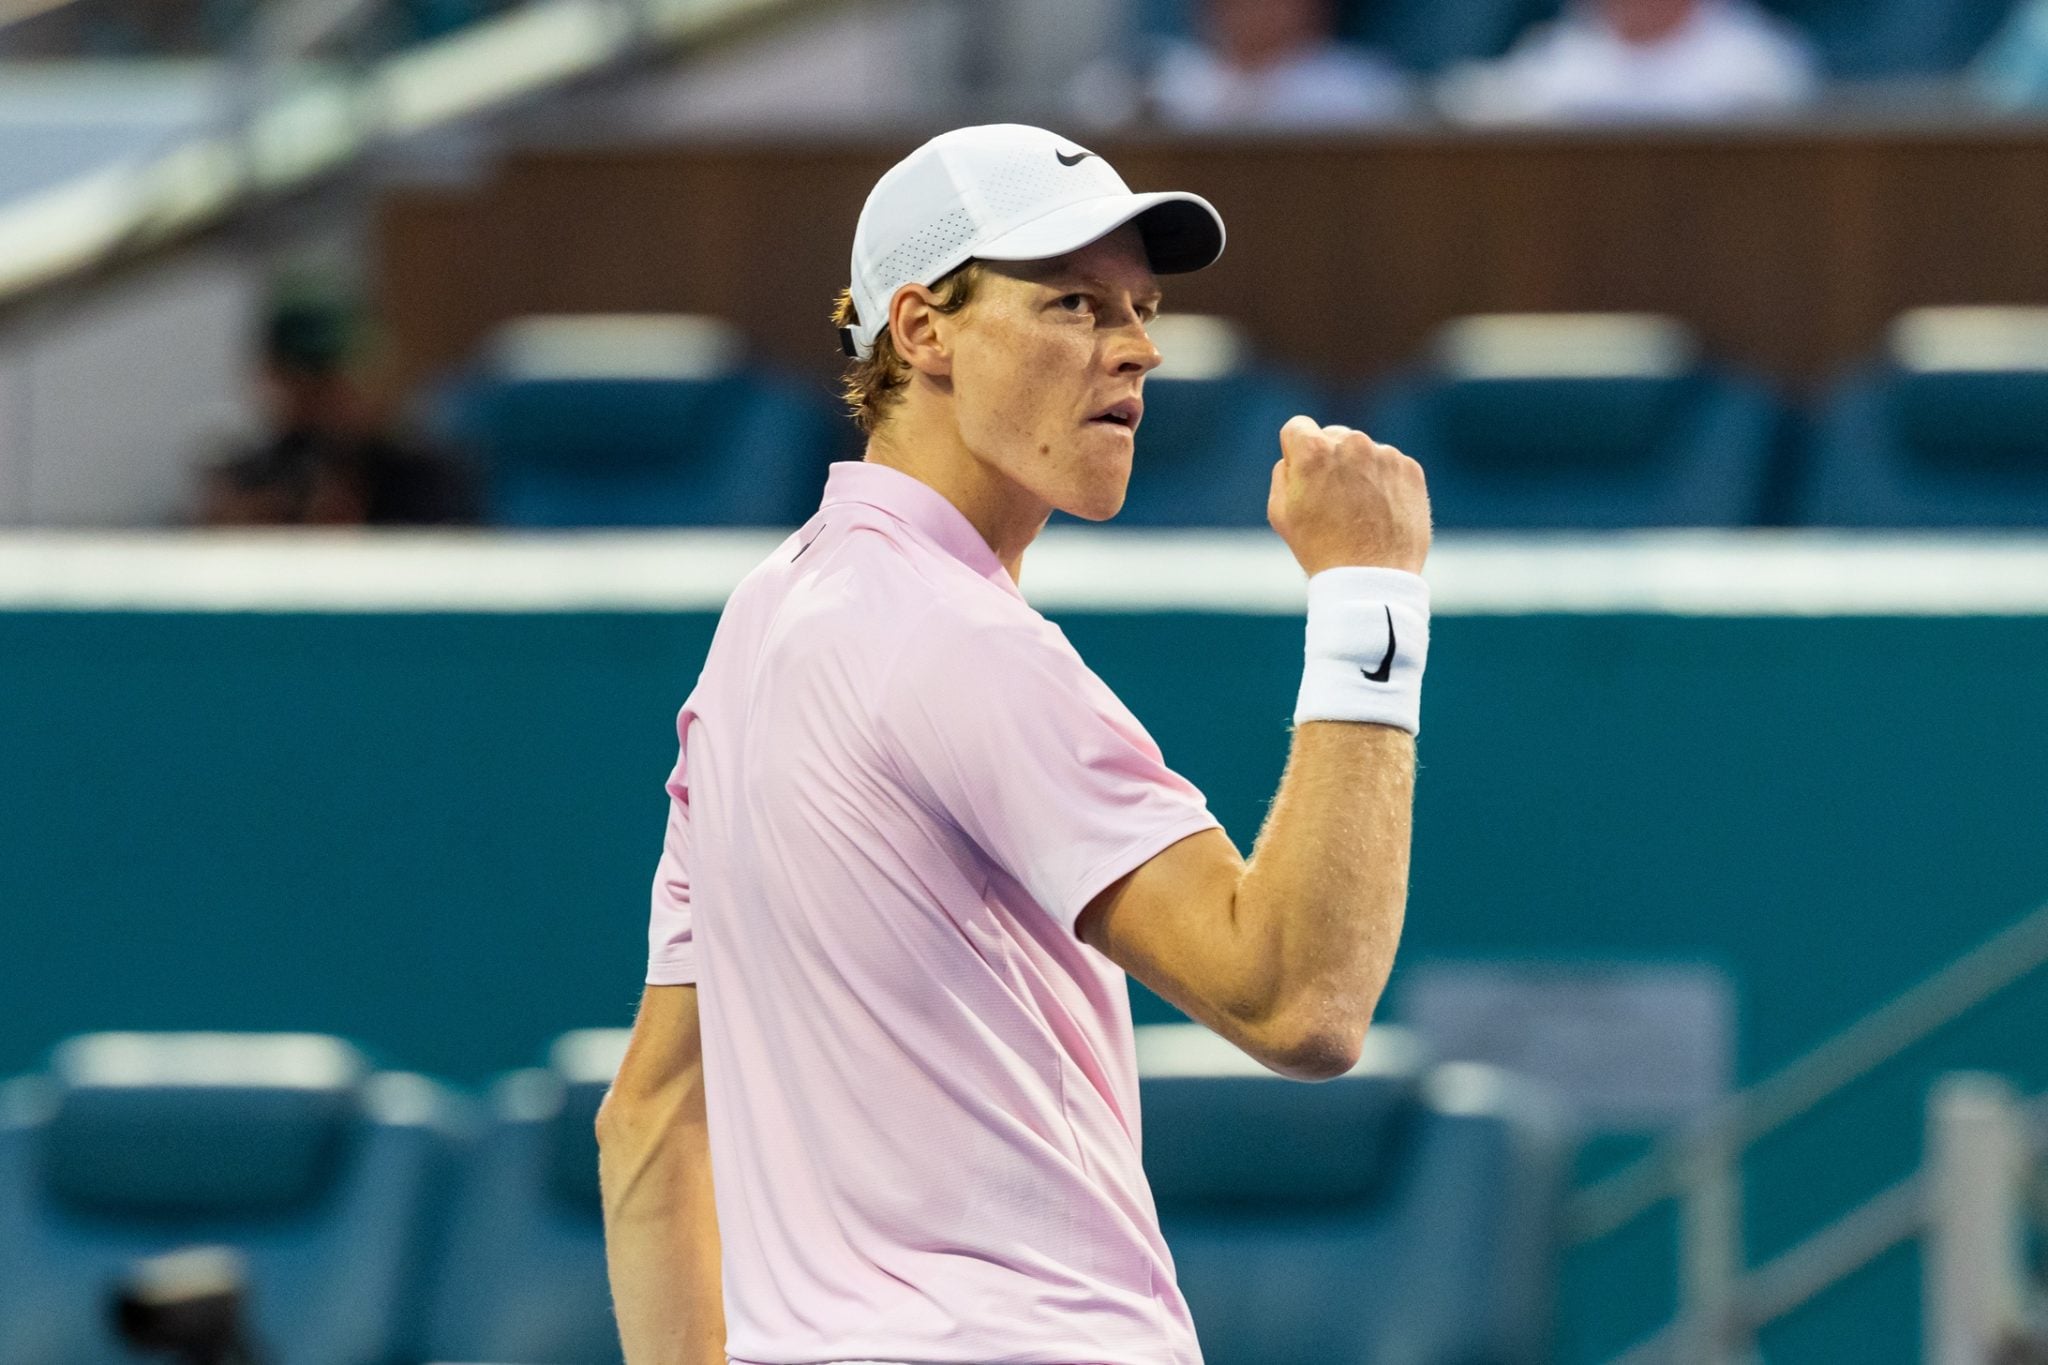
Wimbledon Men’s Singles Preview: Odds, Futures and Prediction
Jannik Sinner is the clear Wimbledon favourite, but Alexander Zverev and Taylor Fritz offer value as potential challengers in the men’s singles draw.
Wimbledon Women’s Singles Preview: Odds, Futures and Predictions
Mirra Andreeva leads a wide-open Wimbledon women’s field, but Elina Svitolina offers serious long-shot value at the All-England Club.

Egypt vs. Iran Prediction: FIFA World Cup Odds, Betting Picks
New Zealand vs. Belgium Prediction: FIFA World Cup Odds, Betting Picks
Cape Verde vs. Saudi Arabia Prediction: FIFA World Cup Odds, Betting Picks
Uruguay vs. Spain Prediction: FIFA World Cup Odds, Betting Picks
Los Angeles Sparks vs. Toronto Tempo WNBA preview and prediction
Texas Rangers vs. Toronto Blue Jays: Odds, Prediction
Roughriders vs. Argonauts Prediction: CFL Week 4 Point Spread, Odds
New York Yankees vs. Boston Red Sox: Odds, Prediction
Wimbledon Men’s Singles Preview: Odds, Futures and Prediction
Wimbledon Women’s Singles Preview: Odds, Futures and Predictions


