Ducks find power-play success, edge Golden Knights to even series
Beckett Sennecke and Alex Killorn both netted one goal and one assist to pace the host Anaheim Ducks to a 4-3 victory over the Vegas Golden Knights on Sunday night and even their Stanley Cup playoff series.
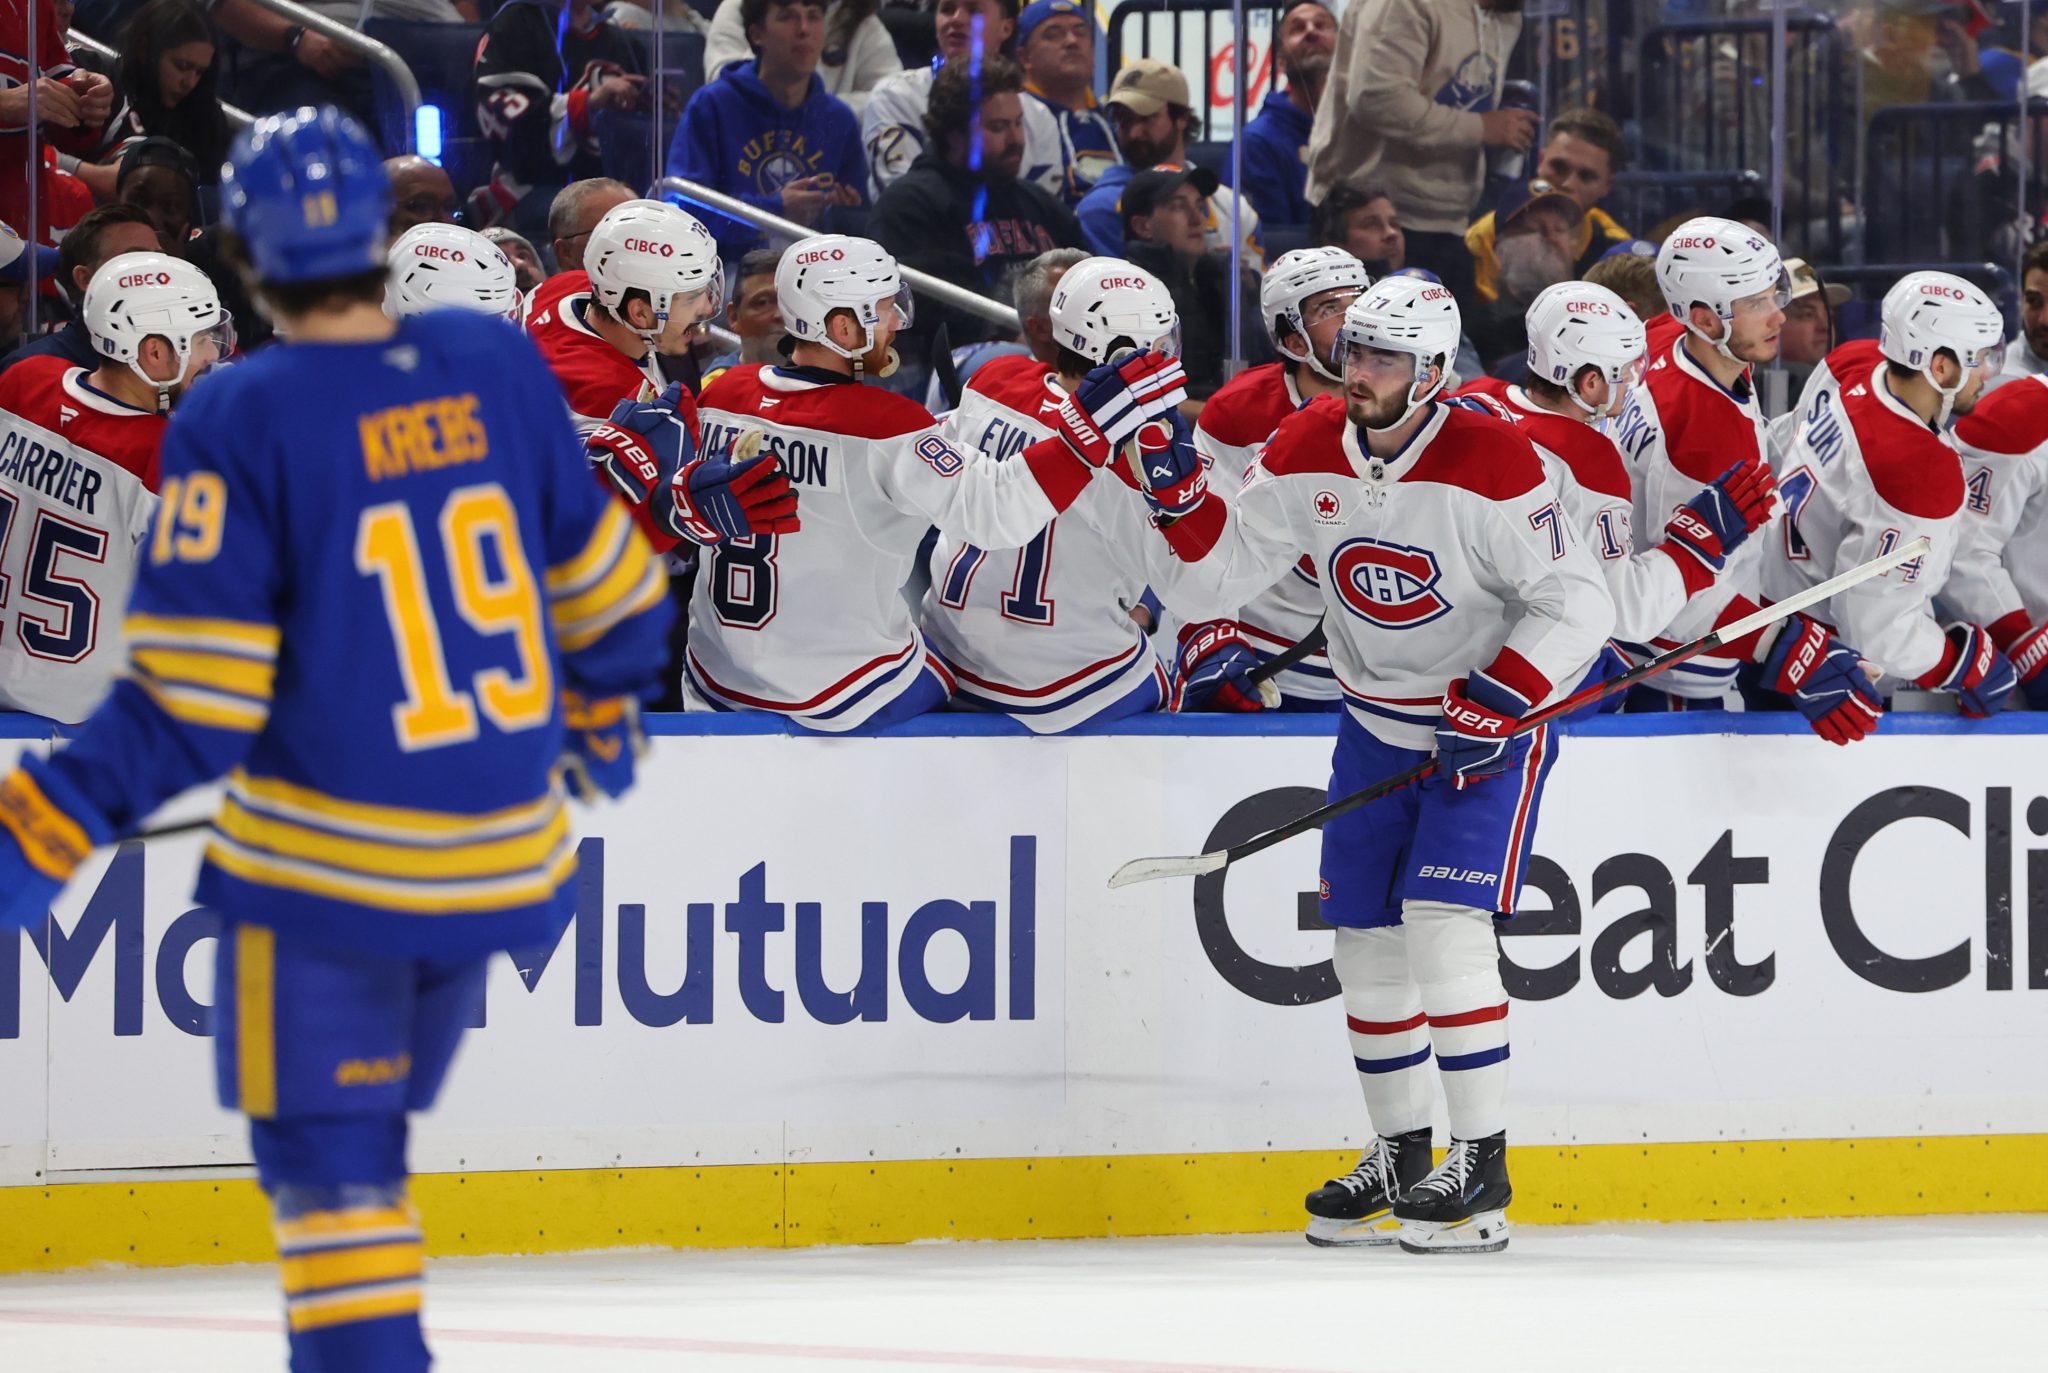
Canadiens clobber Sabres in Game 3, grab series lead
Cole Caufield broke a five-game scoring drought with a tiebreaking power-play goal as the Montreal Canadiens throttled the visiting Buffalo Sabres 6-2 in Game 3, taking a 2-1 best-of-seven Eastern Conference semifinal series lead on Sunday night.
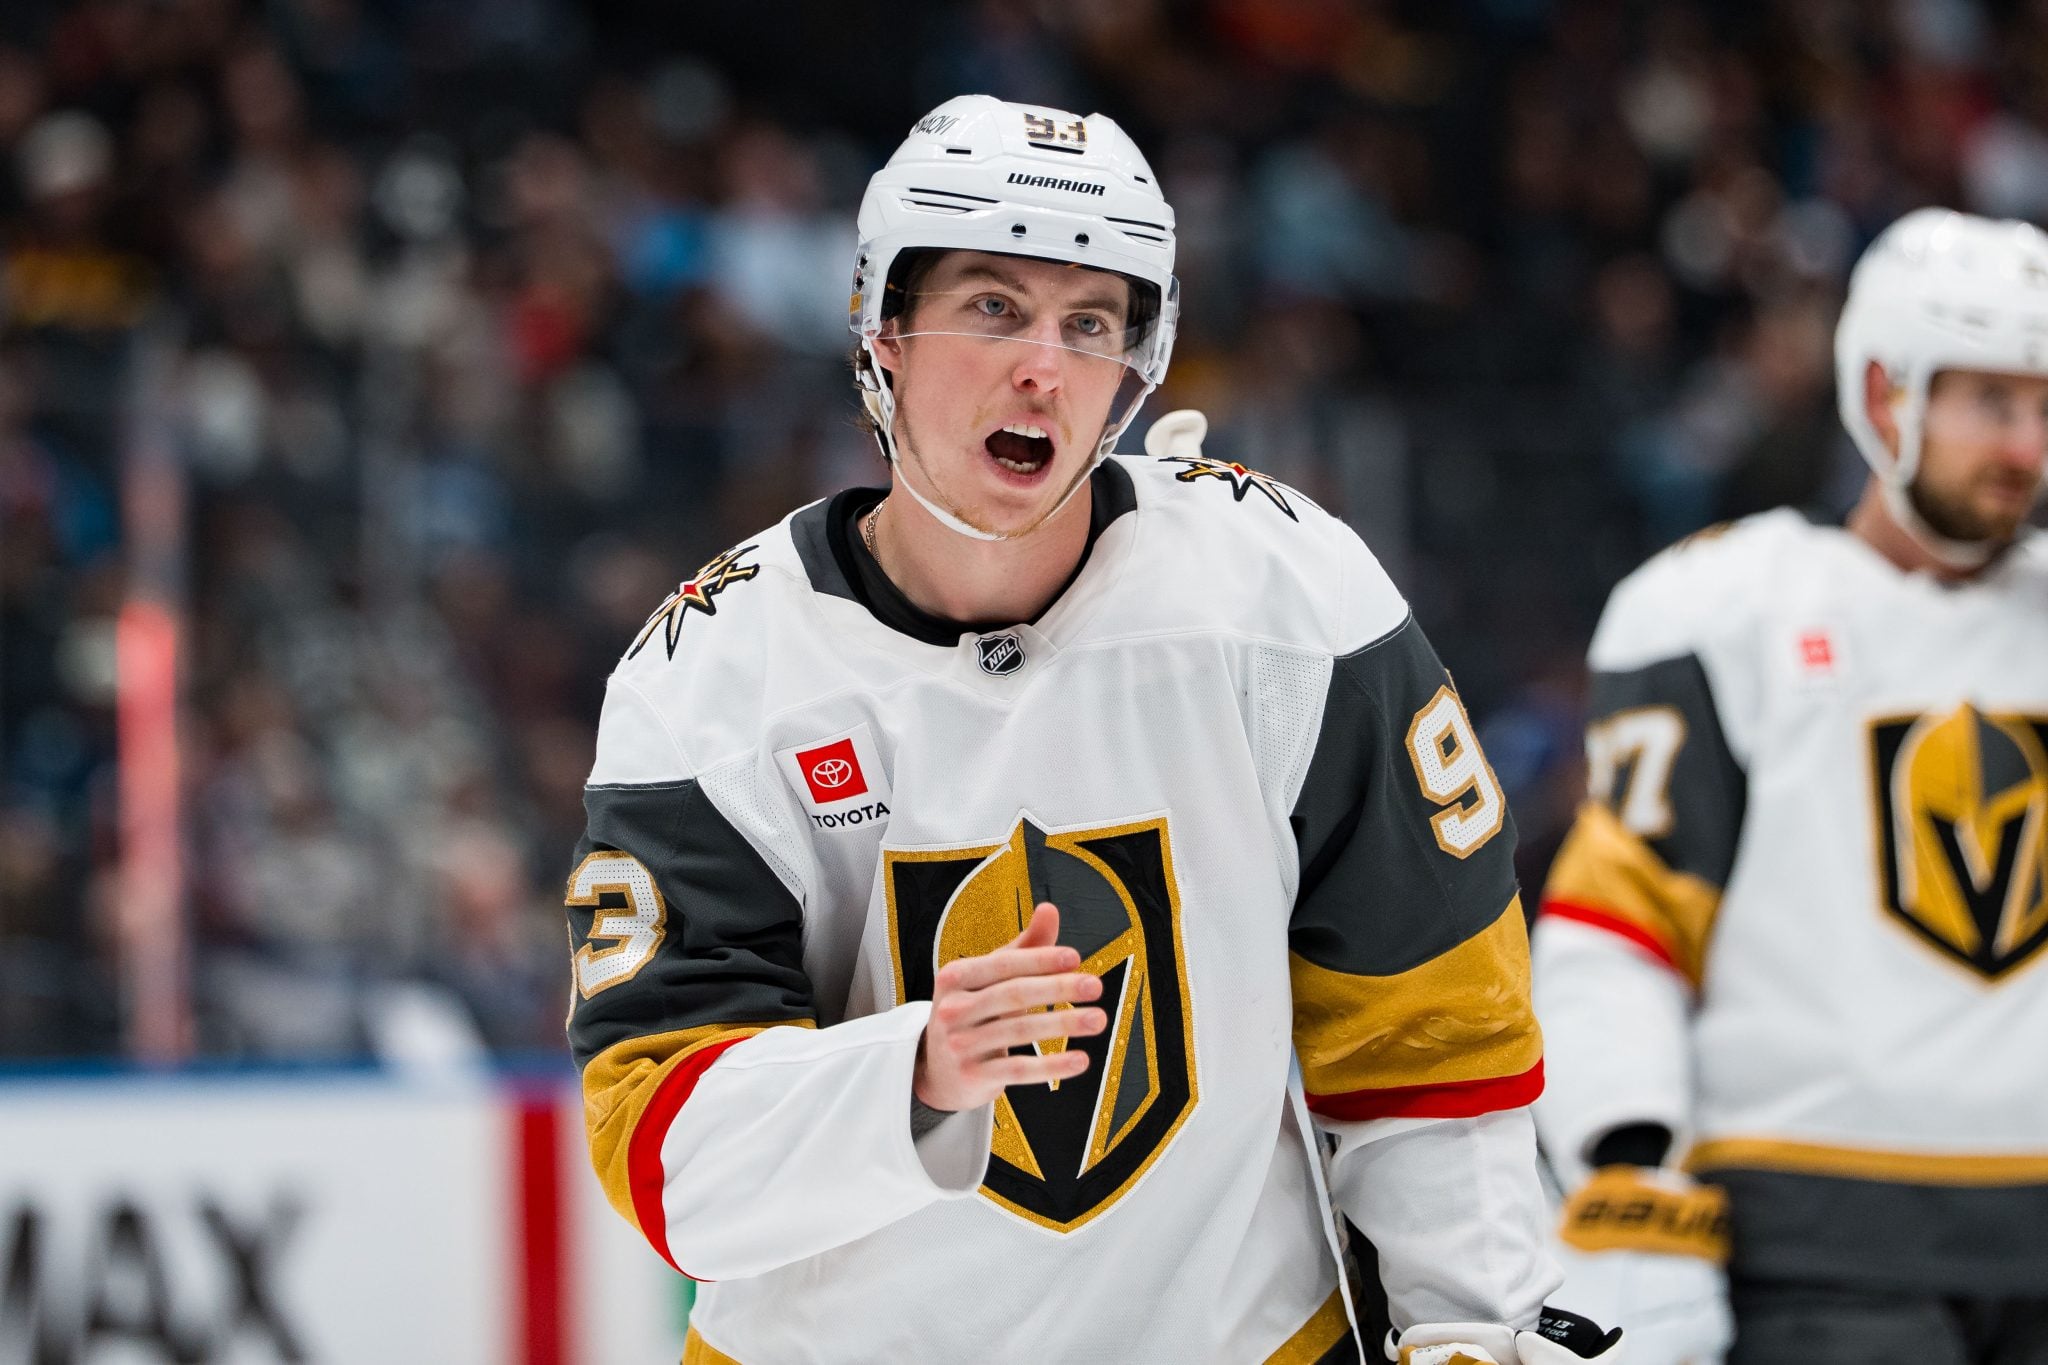
Vegas Golden Knights vs. Anaheim Ducks Game 4 Prediction, NHL Odds
Mitch Marner notched his first career playoff hat-trick on Friday and is red hot with a team-high six goals and 13 points in the playoffs.
Buffalo Sabres vs. Montreal Canadiens Game 3 Prediction, NHL Odds
Buffalo was a -230 series favourite and Montreal +190 entering Game 2, but the Habs’ road win now has them as -115 favourites and the Sabres -105.
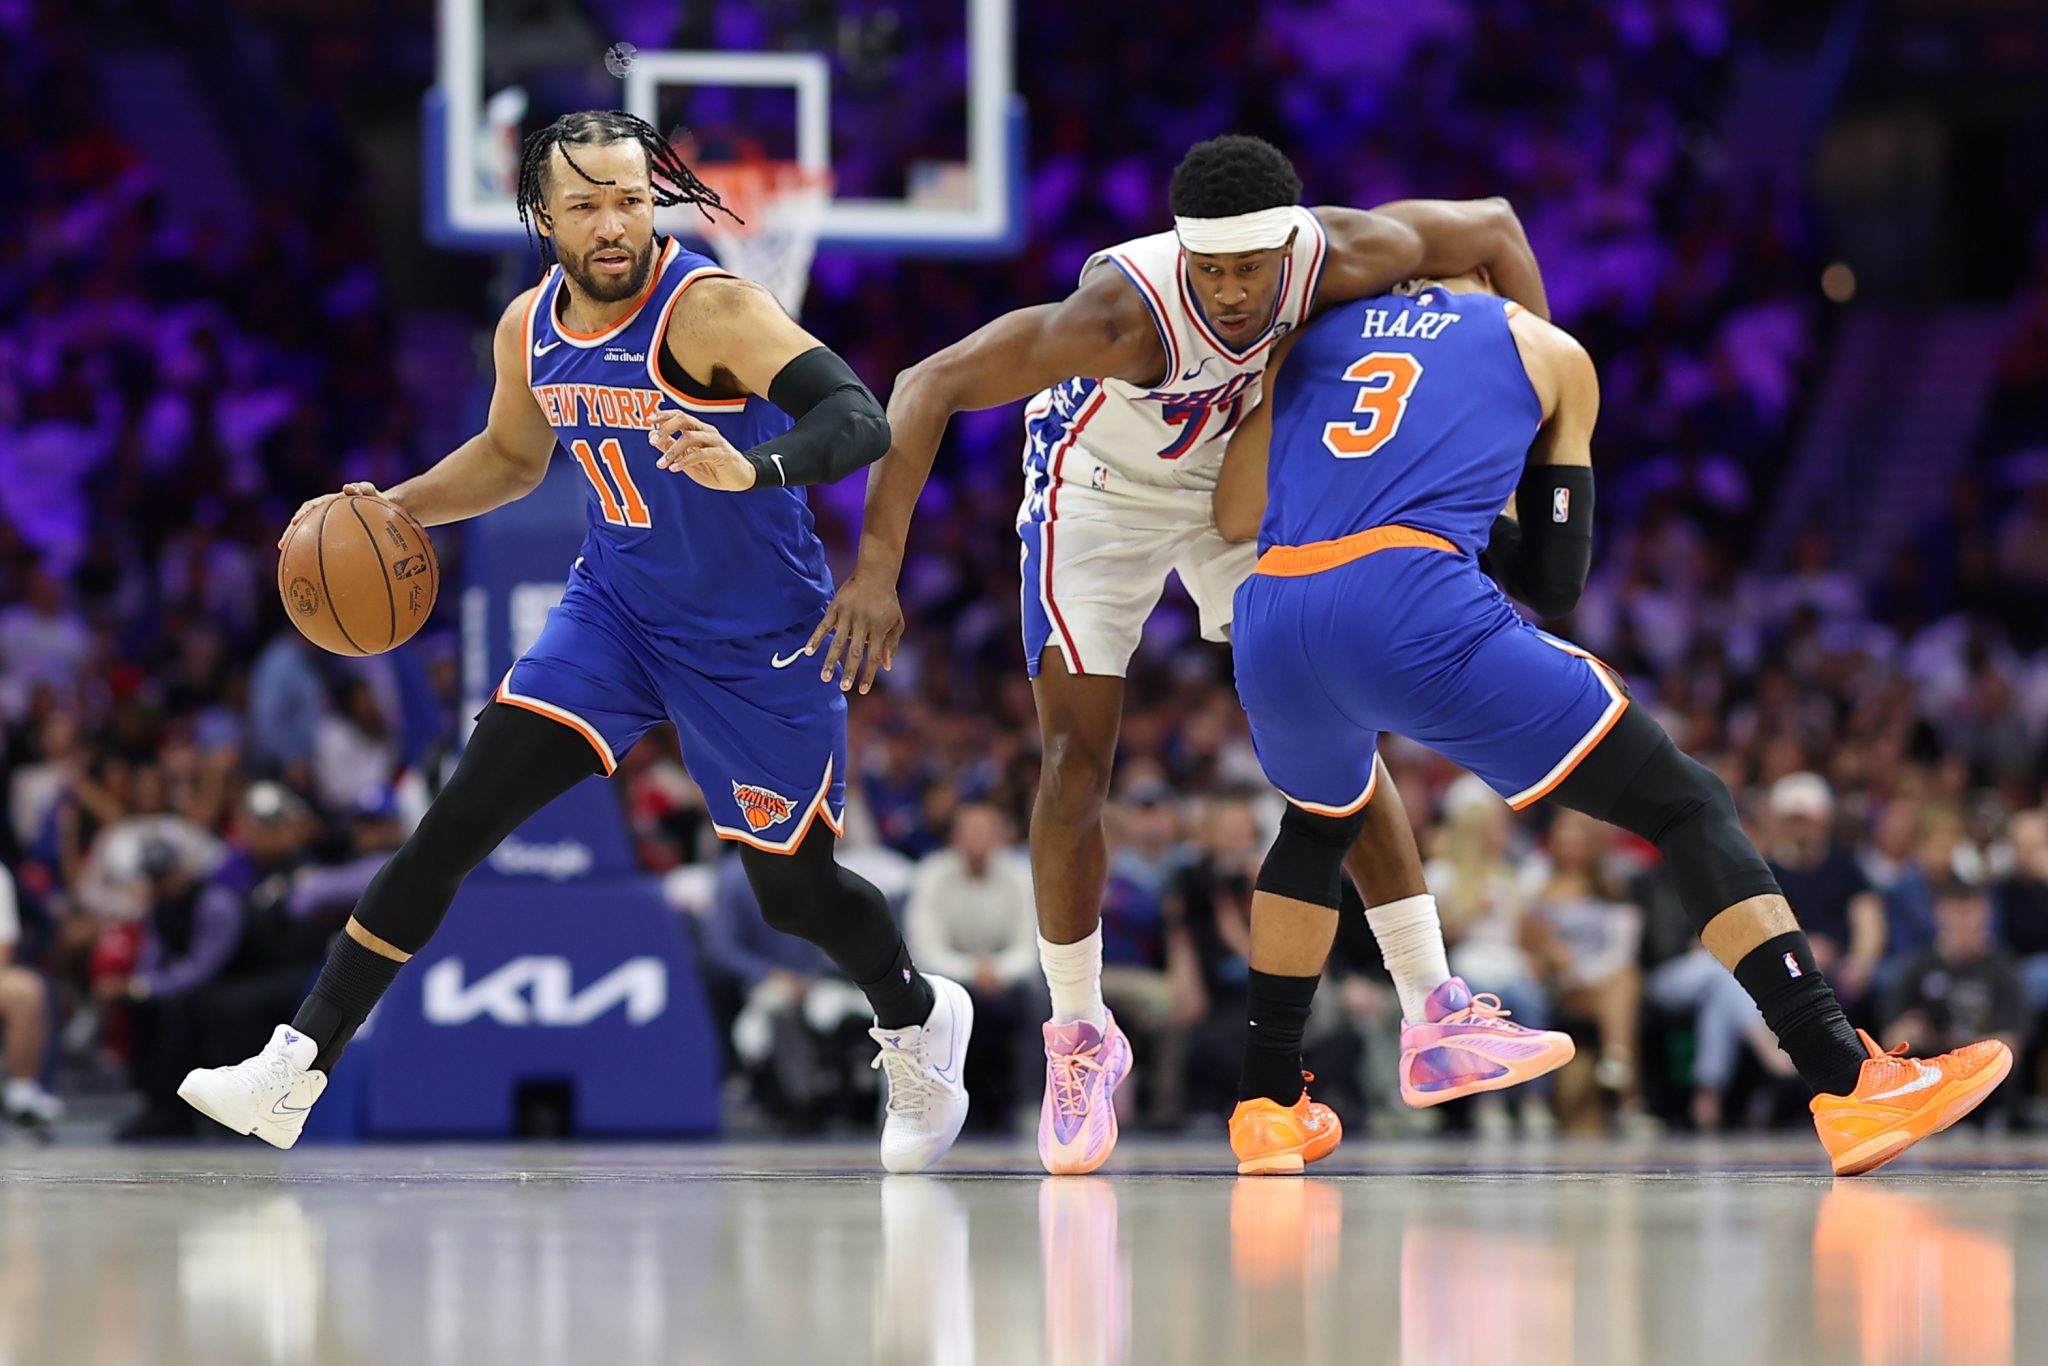
New York Knicks vs. Philadelphia 76ers Game 4 Prediction, NBA Odds
New York is 5-1 against the spread in its last six games and 4-1 ATS in the last five head-to-head encounters with Philadelphia.
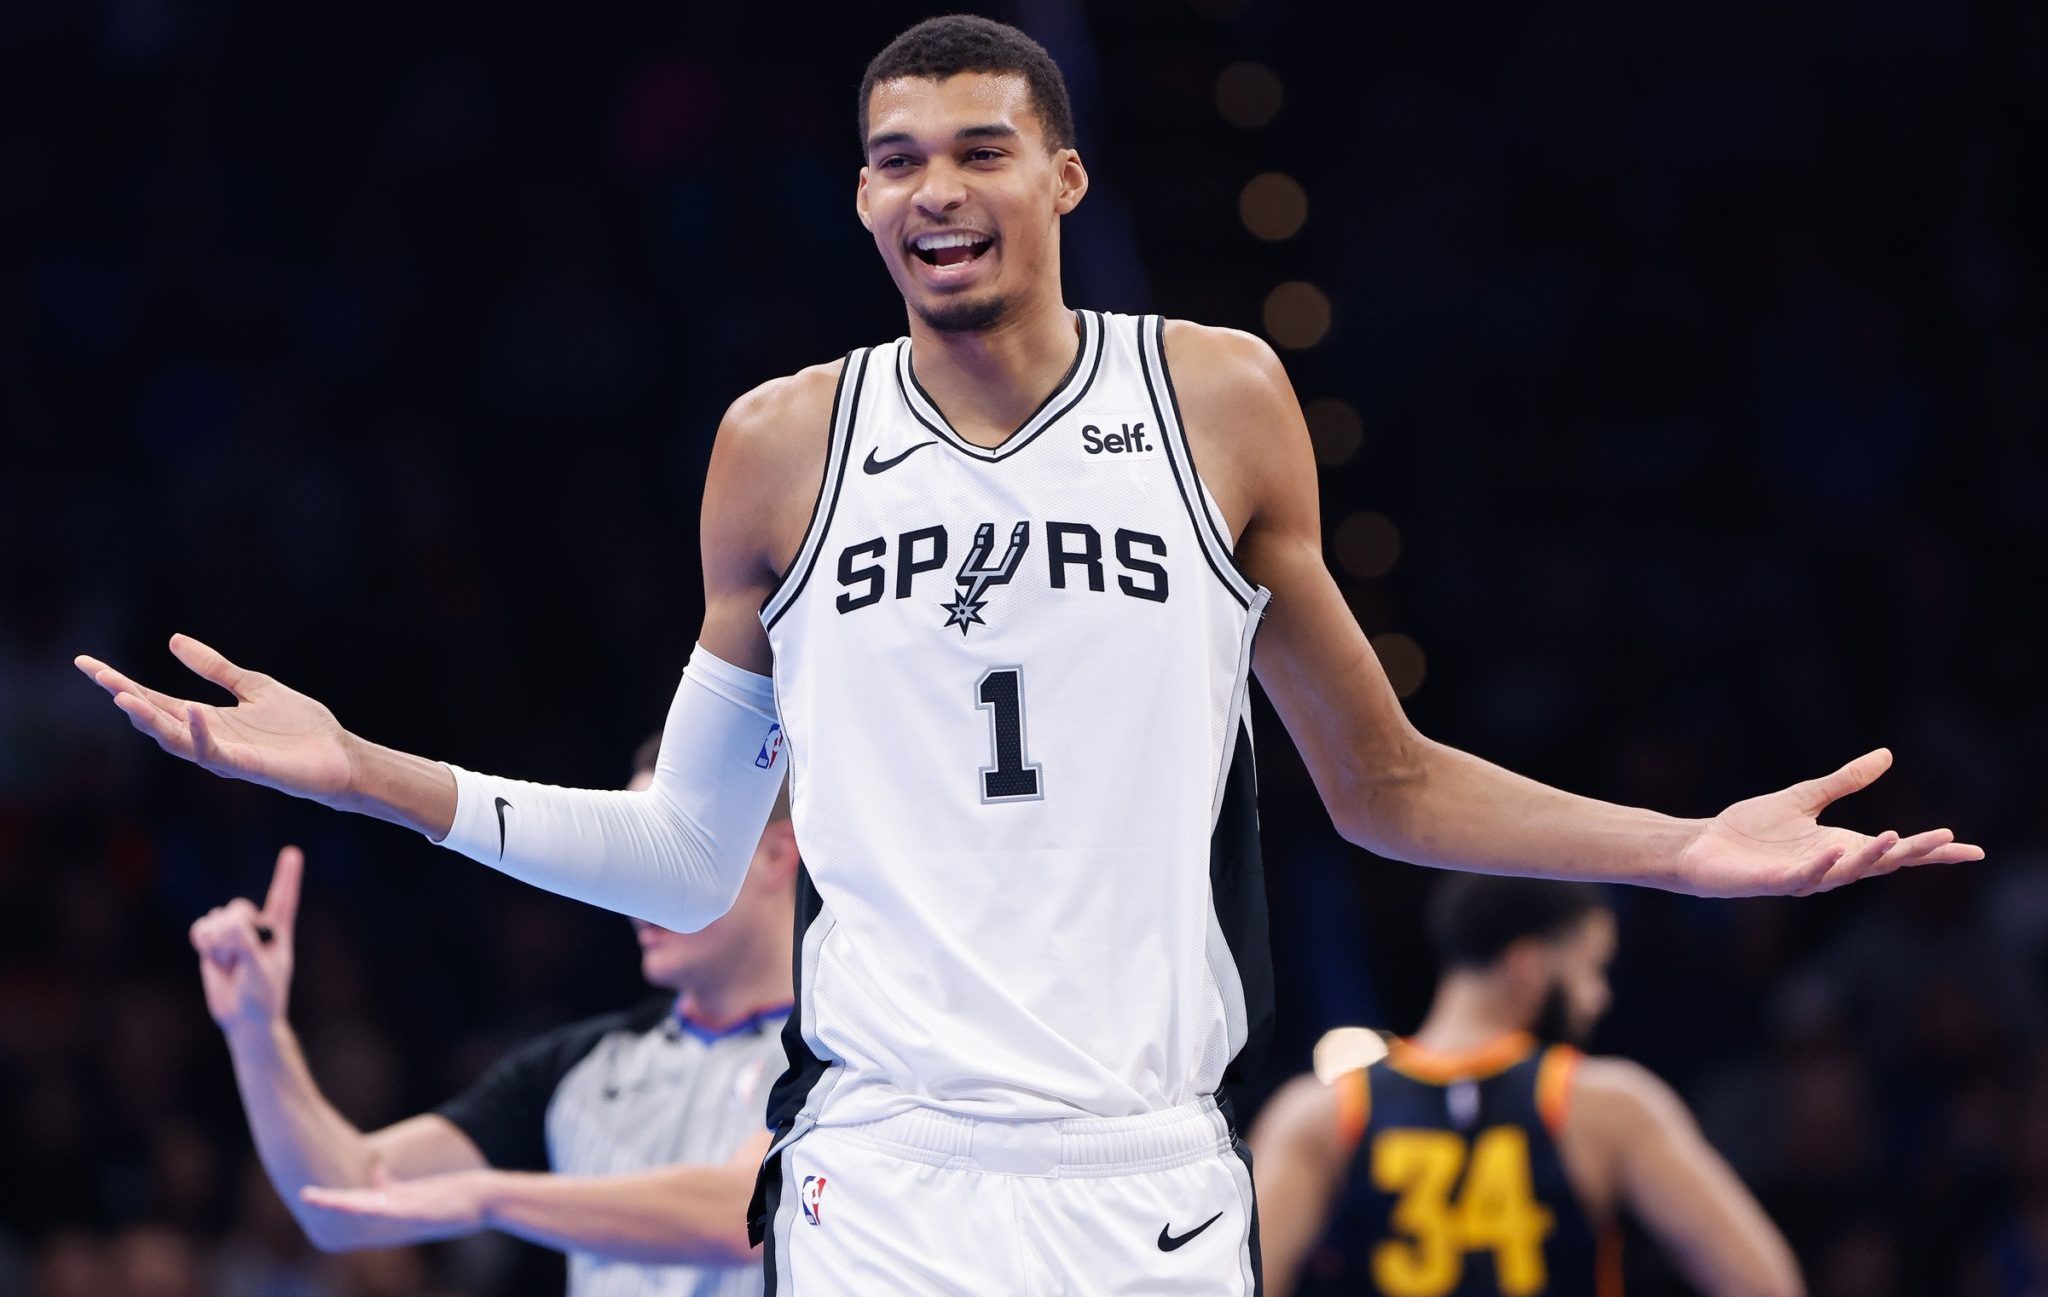
San Antonio Spurs vs. Minnesota Timberwolves Game 4 Prediction, NBA Odds
If Wemby continues to play like this, it’s not a matter of if, but when the Spurs clinch this series.
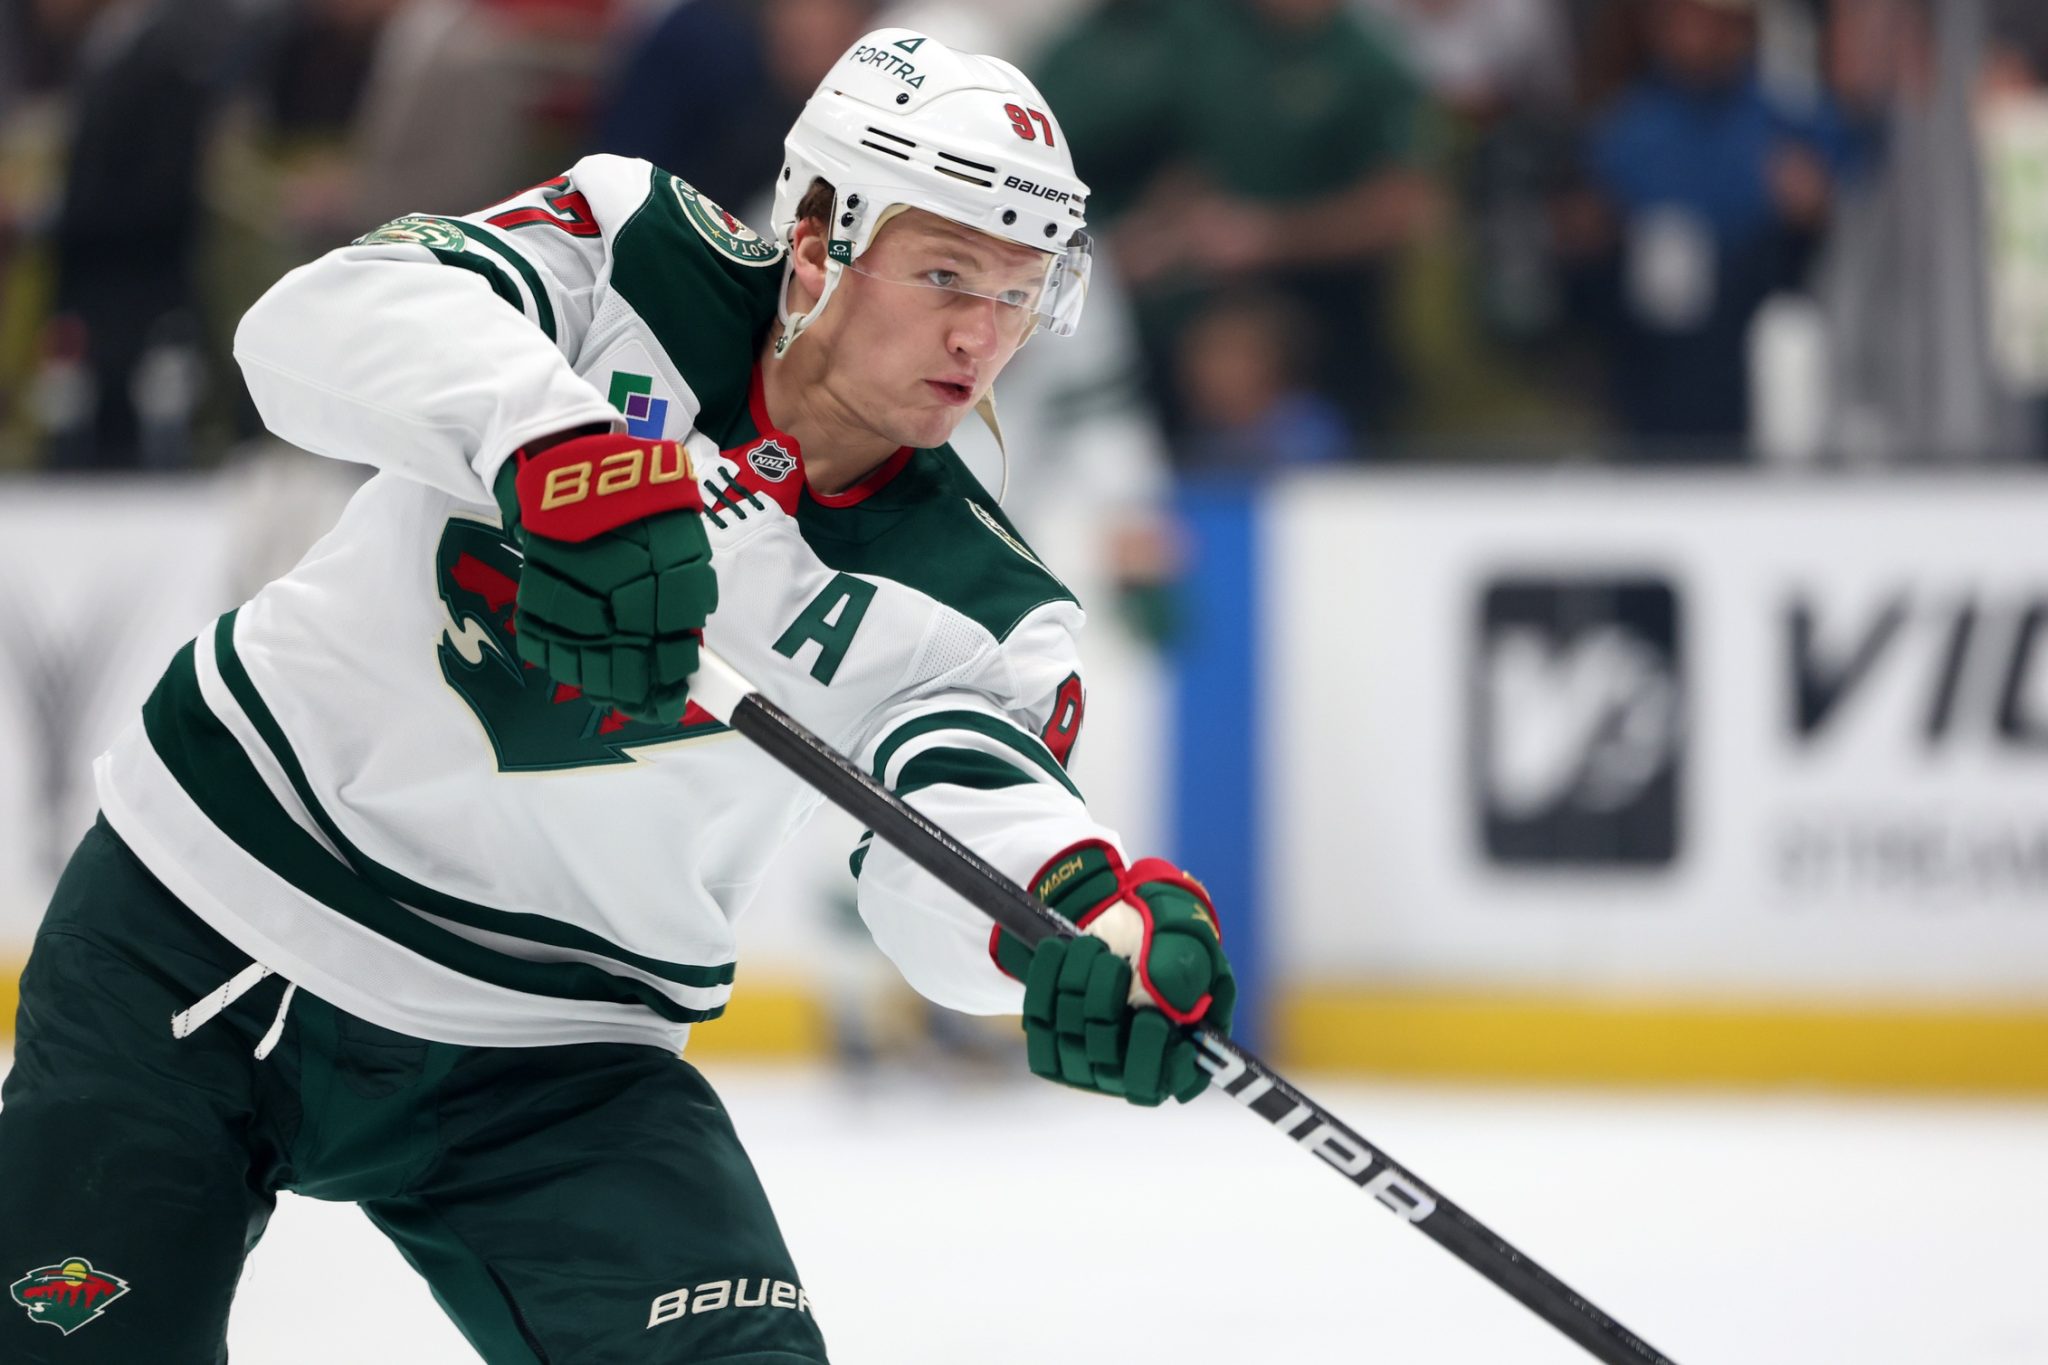
Wild hand Avalanche first postseason loss in dominant fashion
Kirill Kaprizov and Brock Faber each finished with a goal and two assists as the Minnesota Wild pulled away for a 5-1 win over the Colorado Avalanche in Game 3 of their Western Conference semifinals series on Saturday night in Saint Paul, Minn.
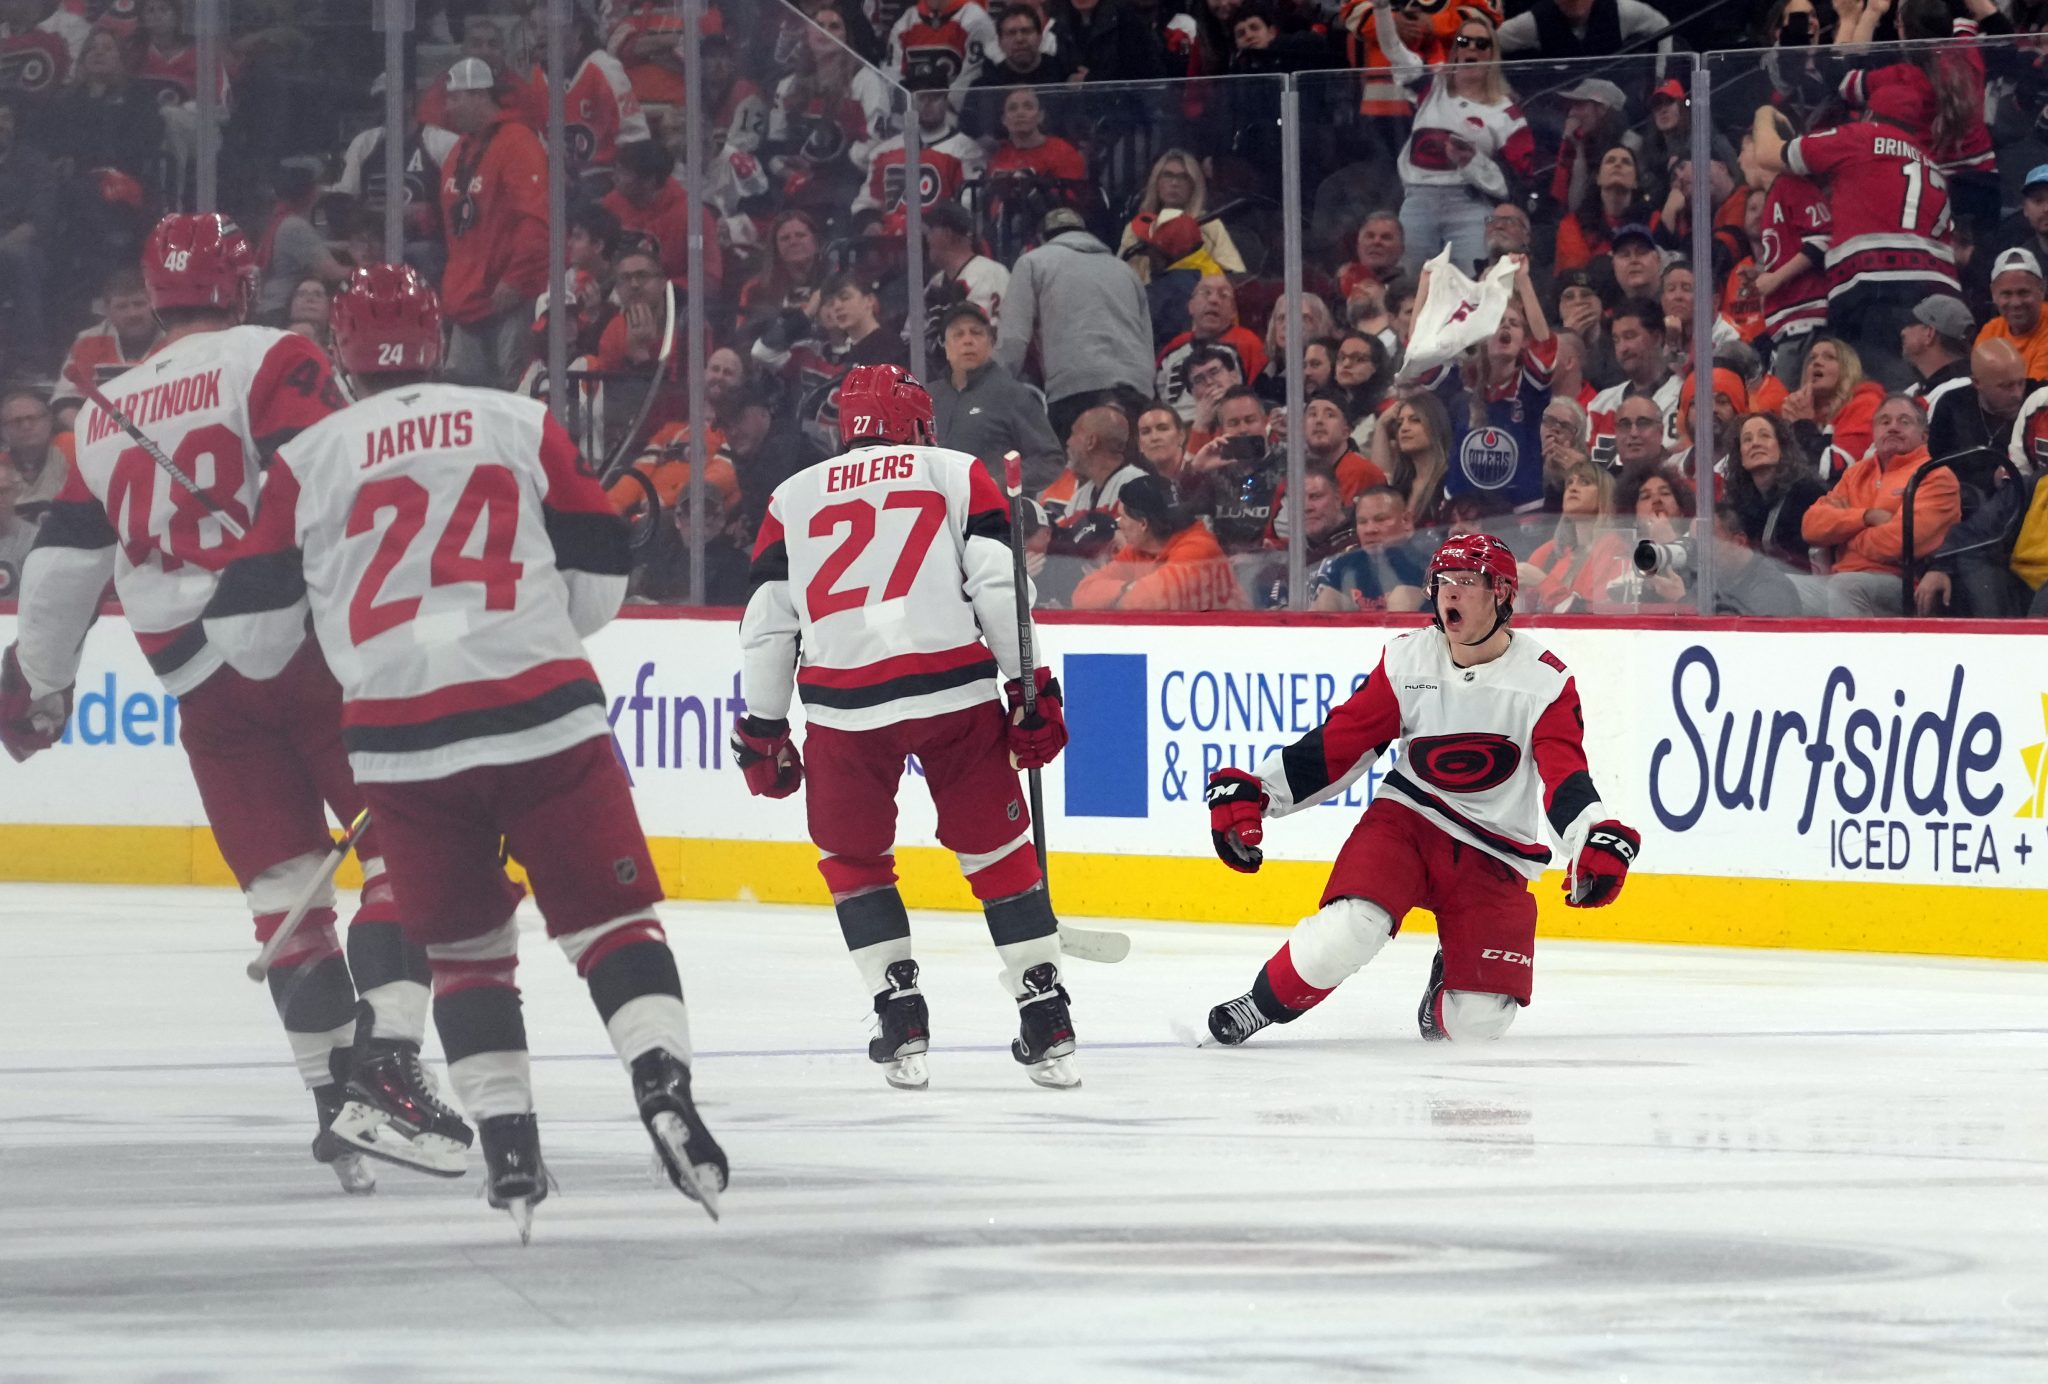
Hurricanes sweep Flyers in OT, advance to East finals
Jackson Blake scored his second goal of the game in overtime and the visiting Carolina Hurricanes swept their second straight Stanley Cup Playoffs series with a 3-2 win against the Philadelphia Flyers in Game 4 of their Eastern Conference semifinal matchup on Saturday evening.
Carolina Hurricanes vs. Philadelphia Flyers Prediction, NHL Odds
With their backs against the wall, the Flyers will need to come out swinging on Saturday, especially their star players.

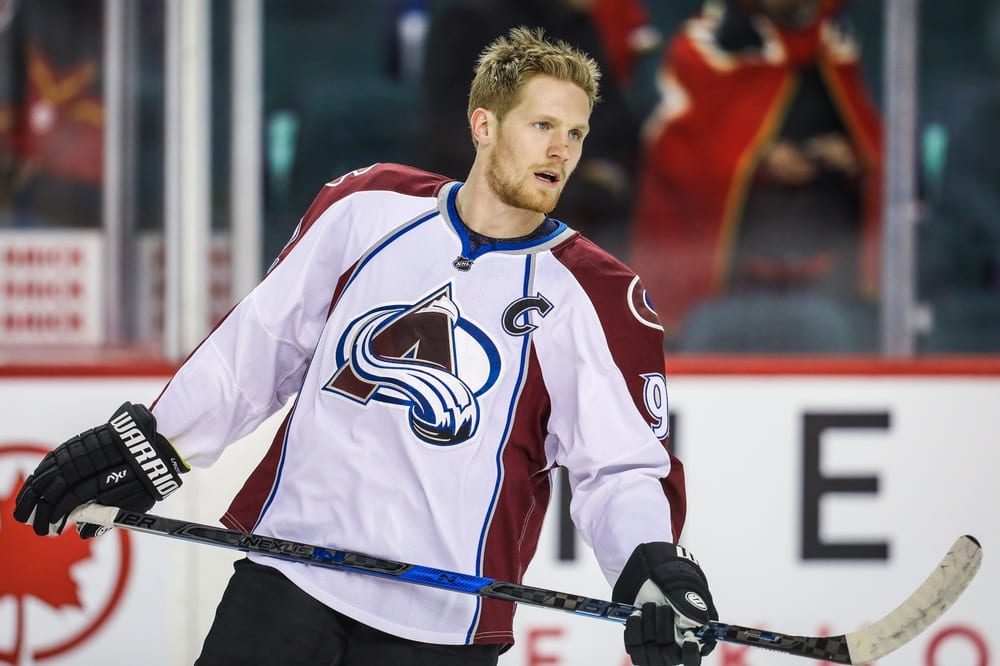
Colorado Avalanche vs. Minnesota Wild Prediction, NHL Odds
Gabriel Landeskog has displayed youthful form with three goals and seven points during a five-game streak
Ducks find power-play success, edge Golden Knights to even series
Canadiens clobber Sabres in Game 3, grab series lead
Vegas Golden Knights vs. Anaheim Ducks Game 4 Prediction, NHL Odds
Buffalo Sabres vs. Montreal Canadiens Game 3 Prediction, NHL Odds
New York Knicks vs. Philadelphia 76ers Game 4 Prediction, NBA Odds
San Antonio Spurs vs. Minnesota Timberwolves Game 4 Prediction, NBA Odds
Wild hand Avalanche first postseason loss in dominant fashion
Hurricanes sweep Flyers in OT, advance to East finals
Carolina Hurricanes vs. Philadelphia Flyers Prediction, NHL Odds
Colorado Avalanche vs. Minnesota Wild Prediction, NHL Odds


