Illinois (3) vs. Houston (2) Bracket Prediction: March Madness Sweet 16 Odds
The Houston Cougars are into the Sweet 16 for the seventh straight year as they prepare to face Illinois in a 2 vs. 3 battle.

Iowa (9) vs. Nebraska (4) Bracket Prediction: March Madness Sweet 16 Odds
After beating Iowa in overtime earlier this month, Nebraska will look for a repeat performance when they face the Hawkeyes in the Sweet 16 on Thursday.

Ottawa Senators vs. Detroit Red Wings Prediction, NHL Odds
The Detroit Red Wings will look to sweep the season series against the Ottawa Senators as both teams continue the chase to clinch the final wild card spot in the Eastern Conference.

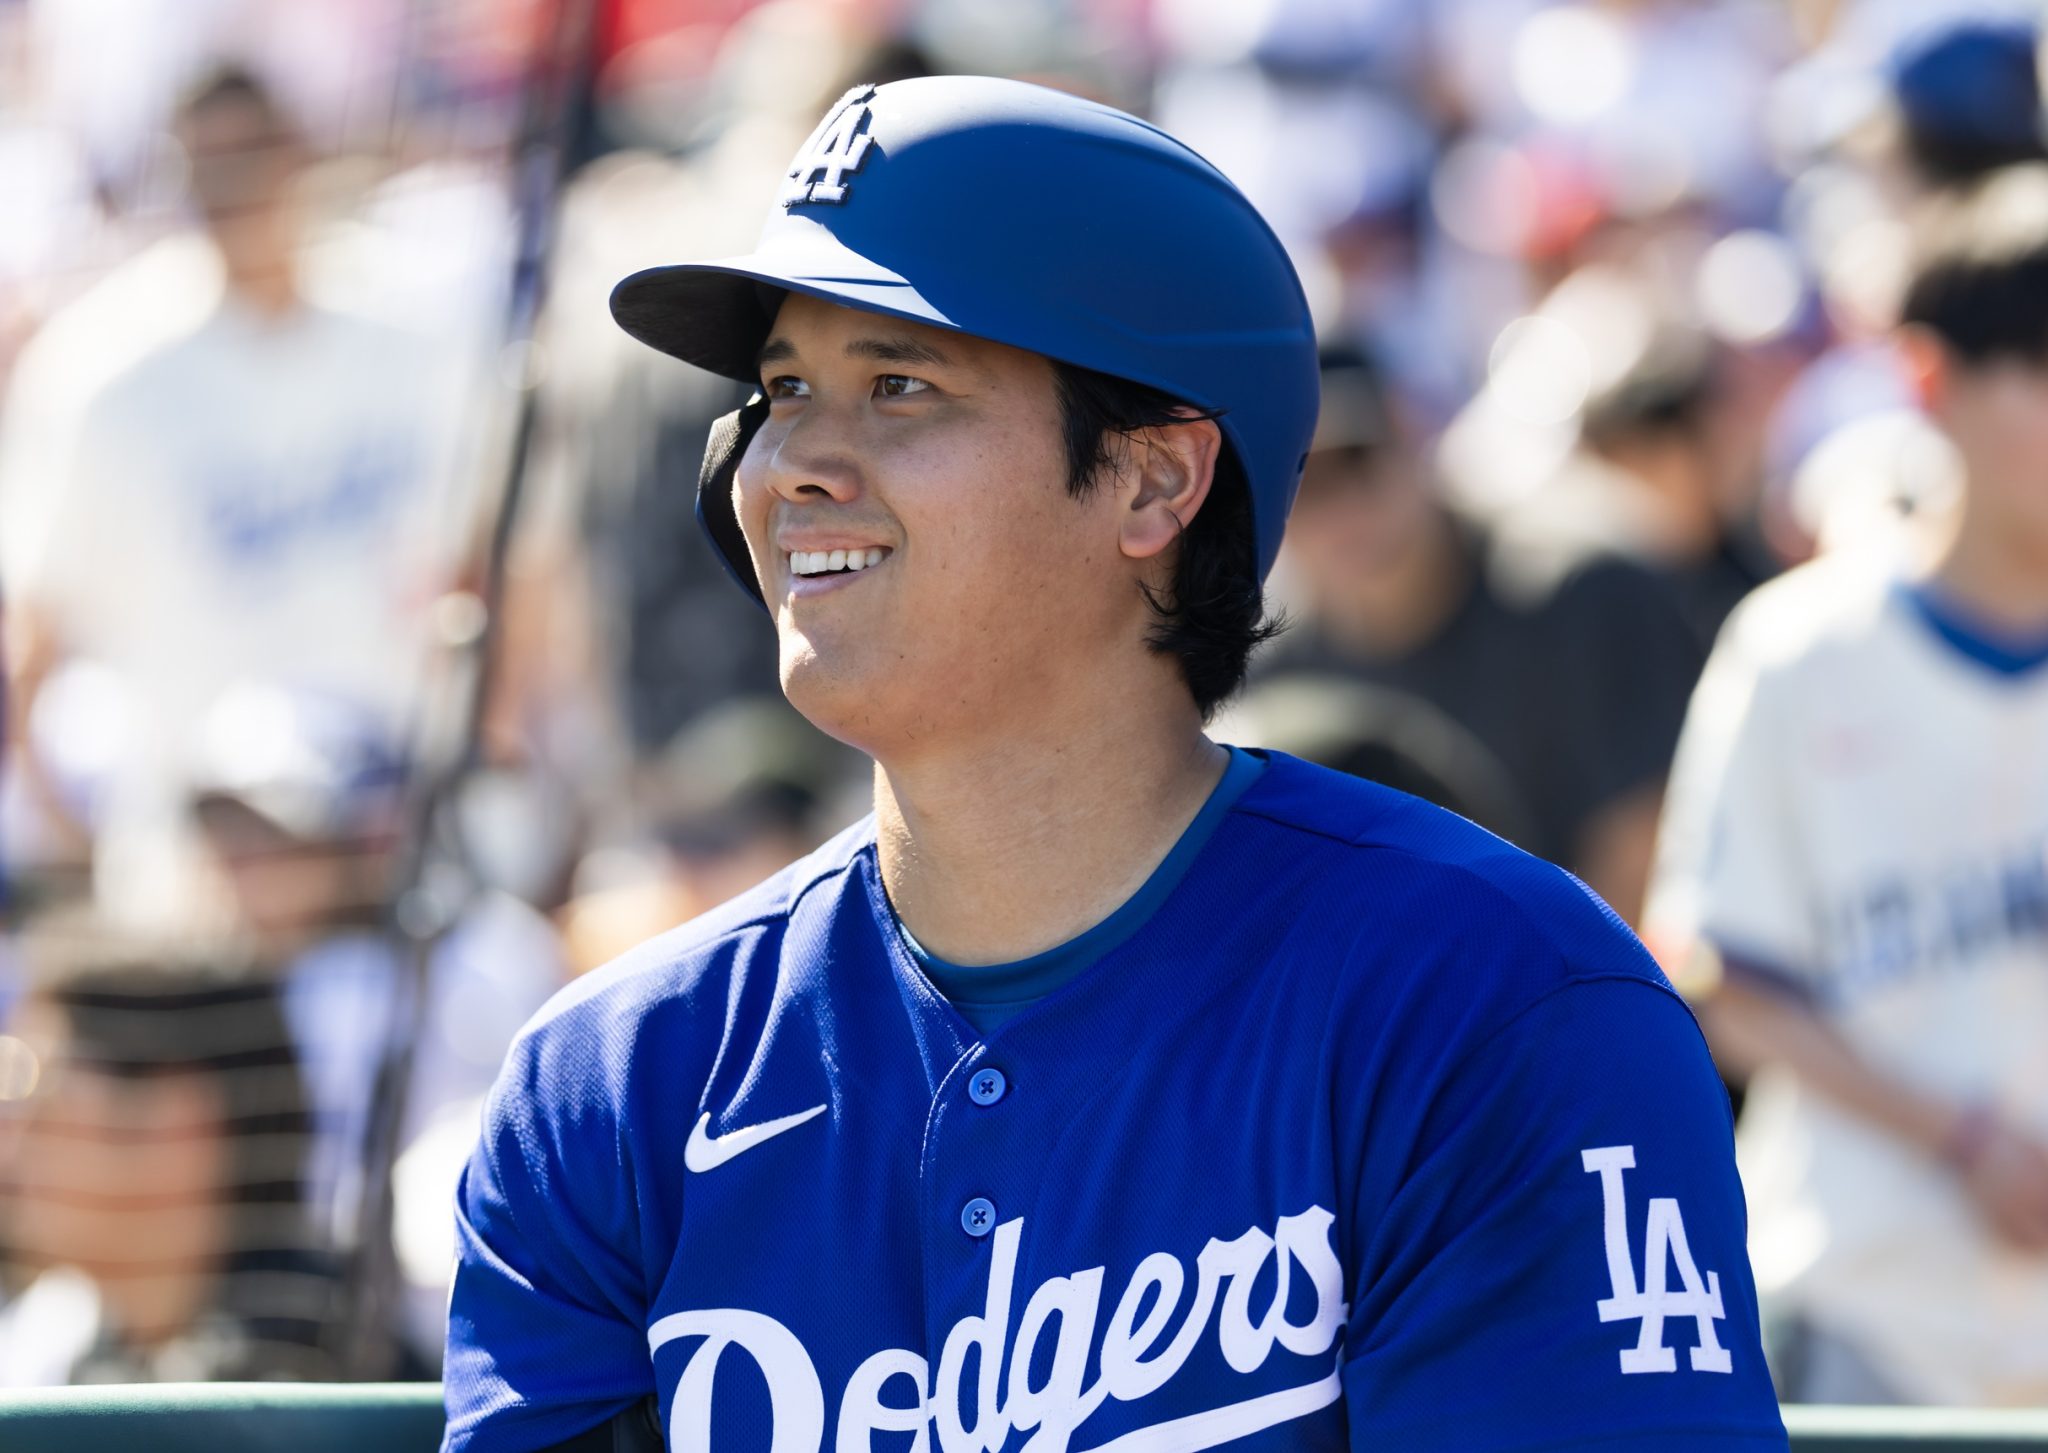
Los Angeles Dodgers 2026 Season Preview: Odds, Predictions and World Series Outlook
The LA Dodgers enter the 2026 MLB season as overwhelming favourites in the futures odds market after winning back-to-back World Series titles.
Michigan State (3) vs. UConn (2) Bracket Prediction: March Madness Sweet 16 Odds
It’s the Big Ten vs. the Big East in the Sweet 16 as No. 3 Michigan State squares off with No. 2 UConn.

St. John’s (5) vs. Duke (1) Bracket Prediction: March Madness Sweet 16 Odds
The No. 5 St. John’s Red Storm are one of the more popular picks for an upset in the Sweet 16 as they prepare to face the No. 1 Duke Blue Devils.

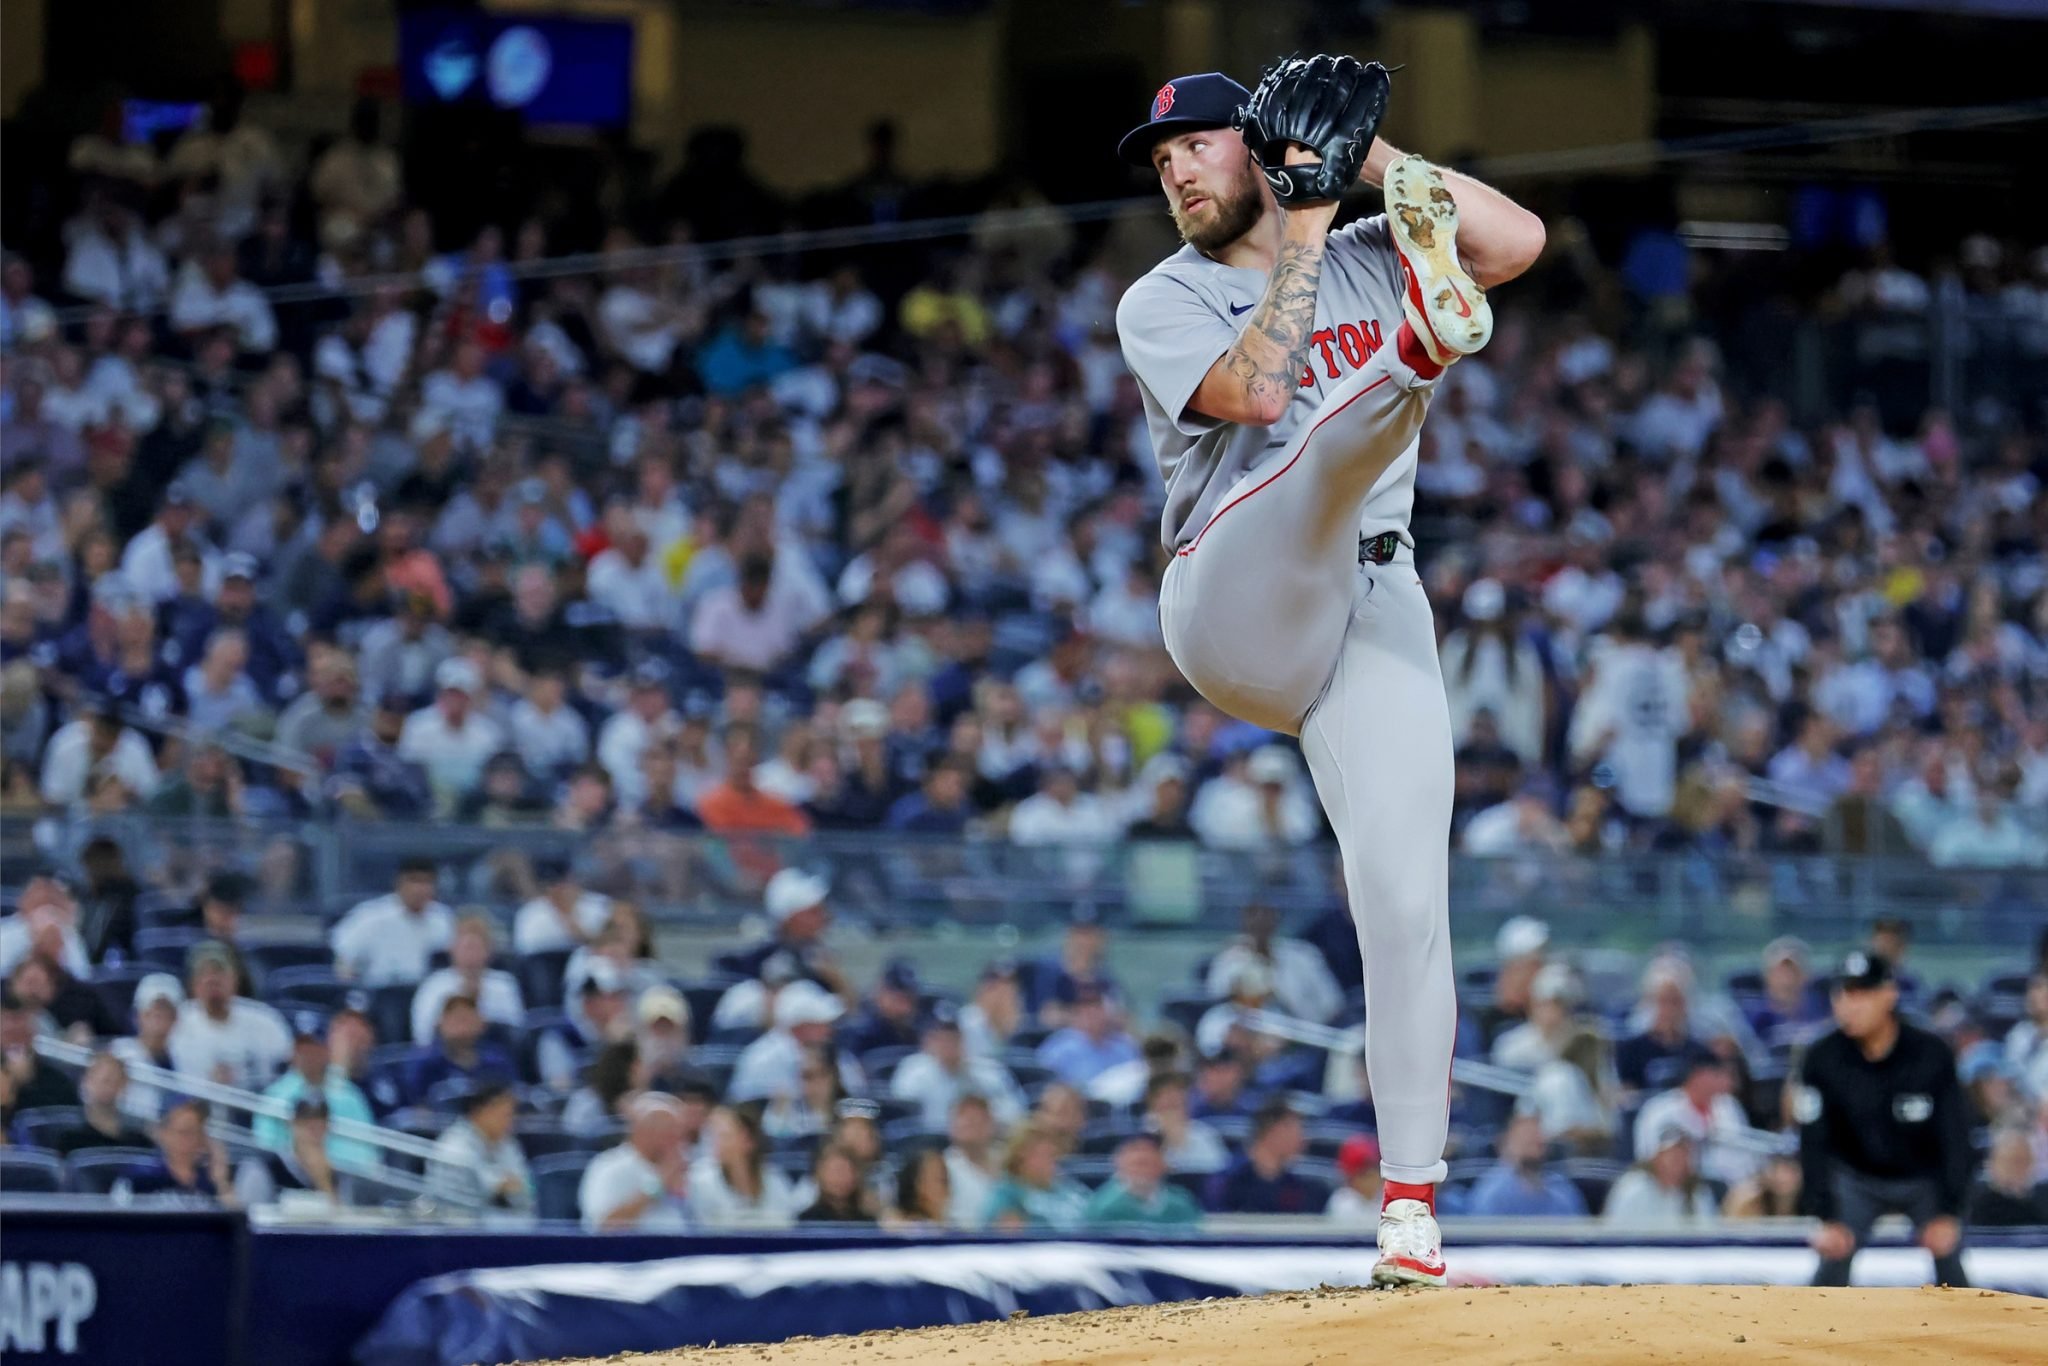
Boston Red Sox 2026 Season Preview: Odds, Predictions and AL East Outlook
The Boston Red Sox enter the 2026 MLB season with competitive futures odds after a playoff appearance in 2025.
Denver Nuggets vs. Phoenix Suns Prediction, NBA Odds
The Phoenix Suns will try to close the gap on the Denver Nuggets in the Western Conference standings when the two teams tangle in Phoenix on Tuesday.

Edmonton Oilers vs. Utah Mammoth Prediction, NHL Odds
The Edmonton Oilers roll into Salt Lake City on Tuesday night for a critical late-season clash against the Utah Mammoth.

Carolina Hurricanes vs. Montreal Canadiens Prediction, NHL Odds
The Montreal Canadiens continue their postseason pursuit on Tuesday night, playing host to the conference-leading Carolina Hurricanes.

Illinois (3) vs. Houston (2) Bracket Prediction: March Madness Sweet 16 Odds
Iowa (9) vs. Nebraska (4) Bracket Prediction: March Madness Sweet 16 Odds
Ottawa Senators vs. Detroit Red Wings Prediction, NHL Odds
Los Angeles Dodgers 2026 Season Preview: Odds, Predictions and World Series Outlook
Michigan State (3) vs. UConn (2) Bracket Prediction: March Madness Sweet 16 Odds
St. John’s (5) vs. Duke (1) Bracket Prediction: March Madness Sweet 16 Odds
Boston Red Sox 2026 Season Preview: Odds, Predictions and AL East Outlook
Denver Nuggets vs. Phoenix Suns Prediction, NBA Odds
Edmonton Oilers vs. Utah Mammoth Prediction, NHL Odds
Carolina Hurricanes vs. Montreal Canadiens Prediction, NHL Odds


