Norway vs. Brazil Round of 16 Prediction: FIFA World Cup Betting Odds and Picks
Brazil and Norway meet in a fascinating Round of 16 showdown at Seattle Stadium on Sunday afternoon, with a place in the World Cup quarterfinals up for grabs.

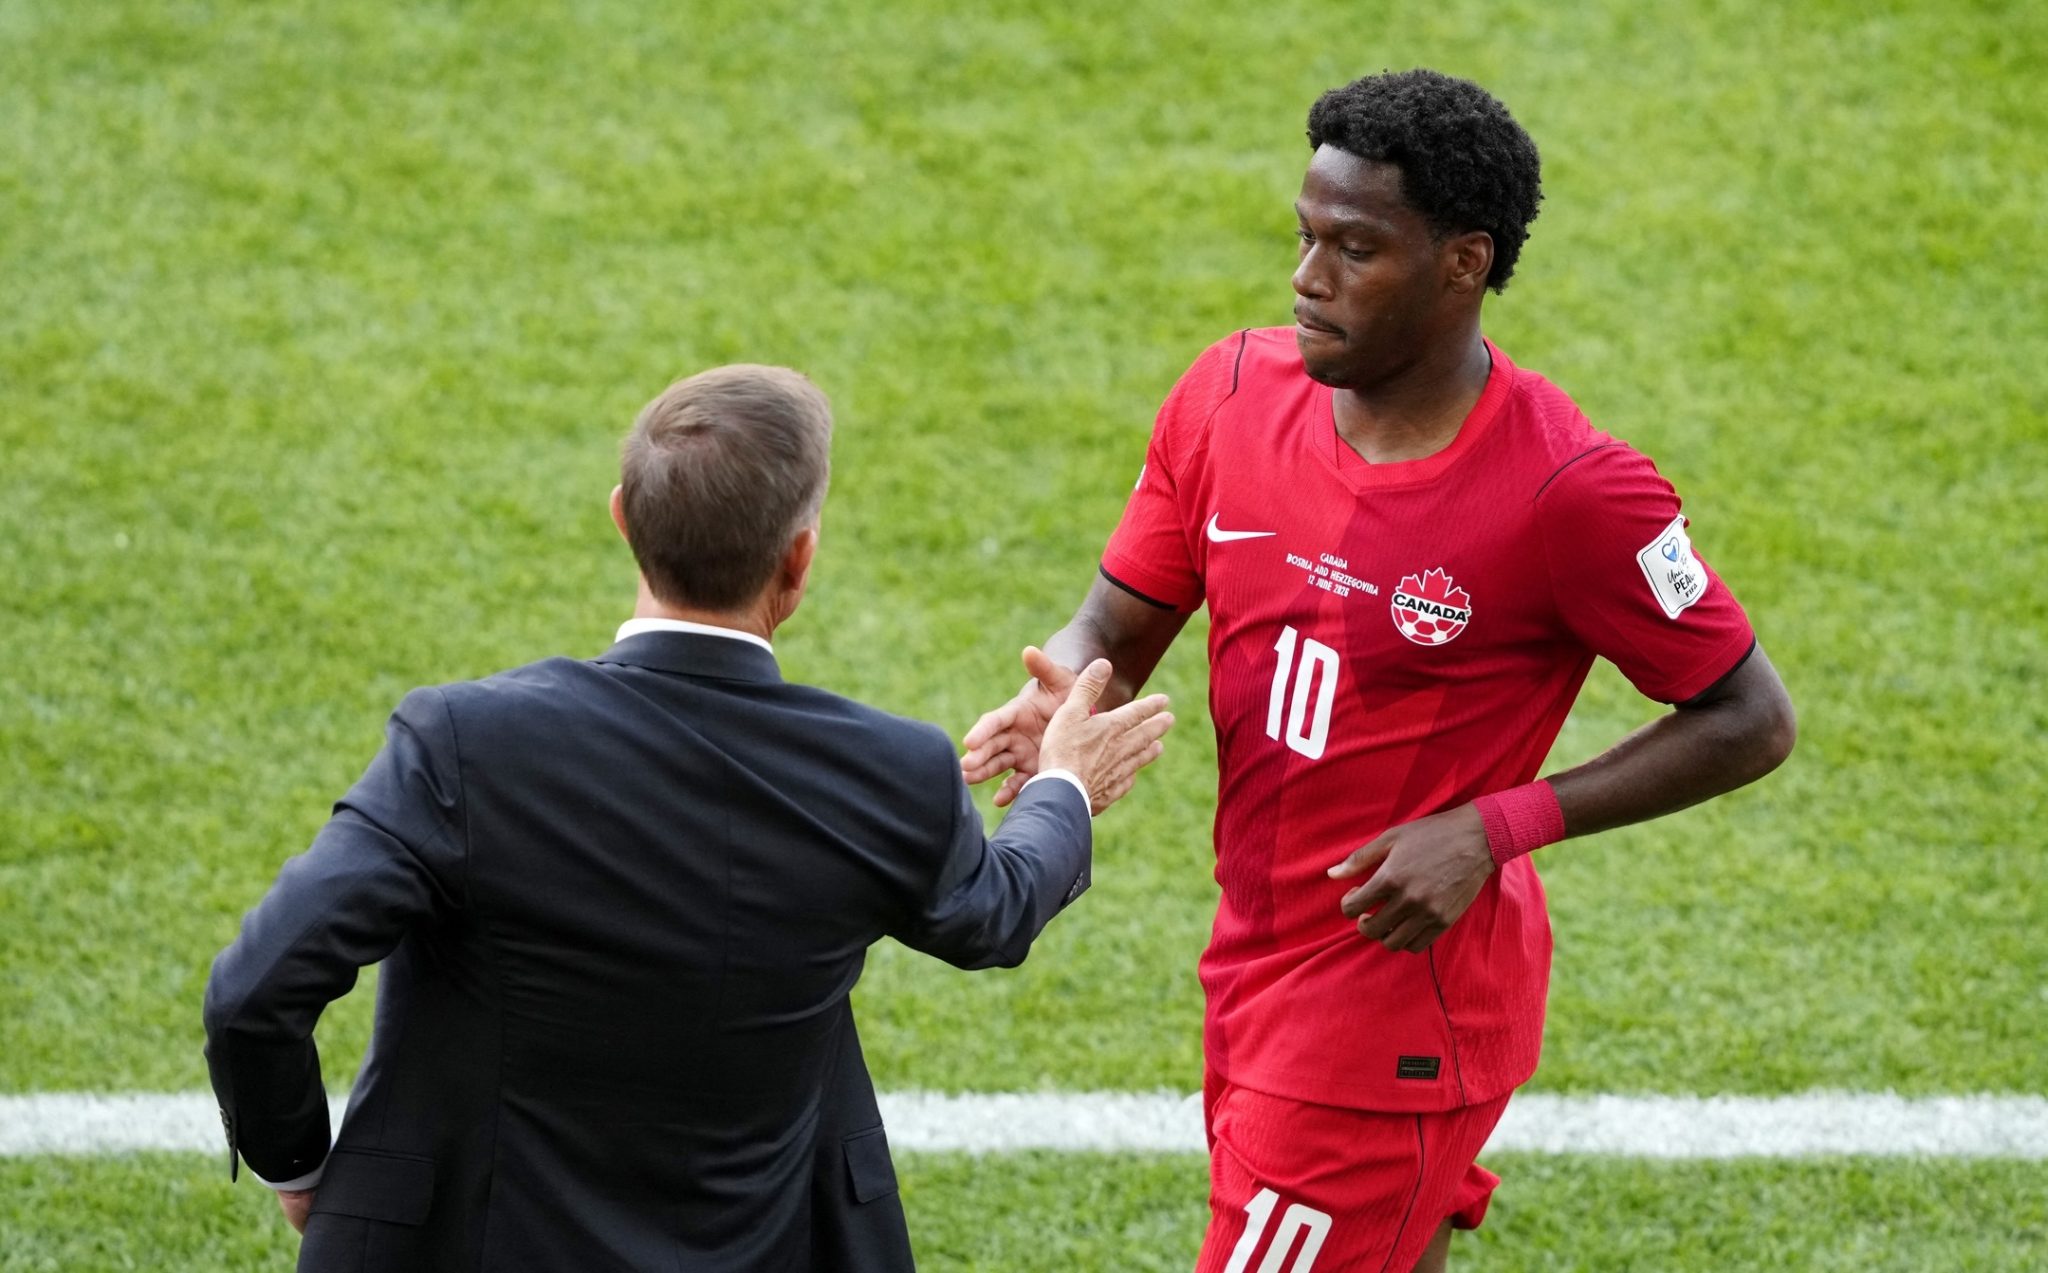
FIFA World Cup Round of 16 Betting Picks for July 4: Jonathan David poised to find the net
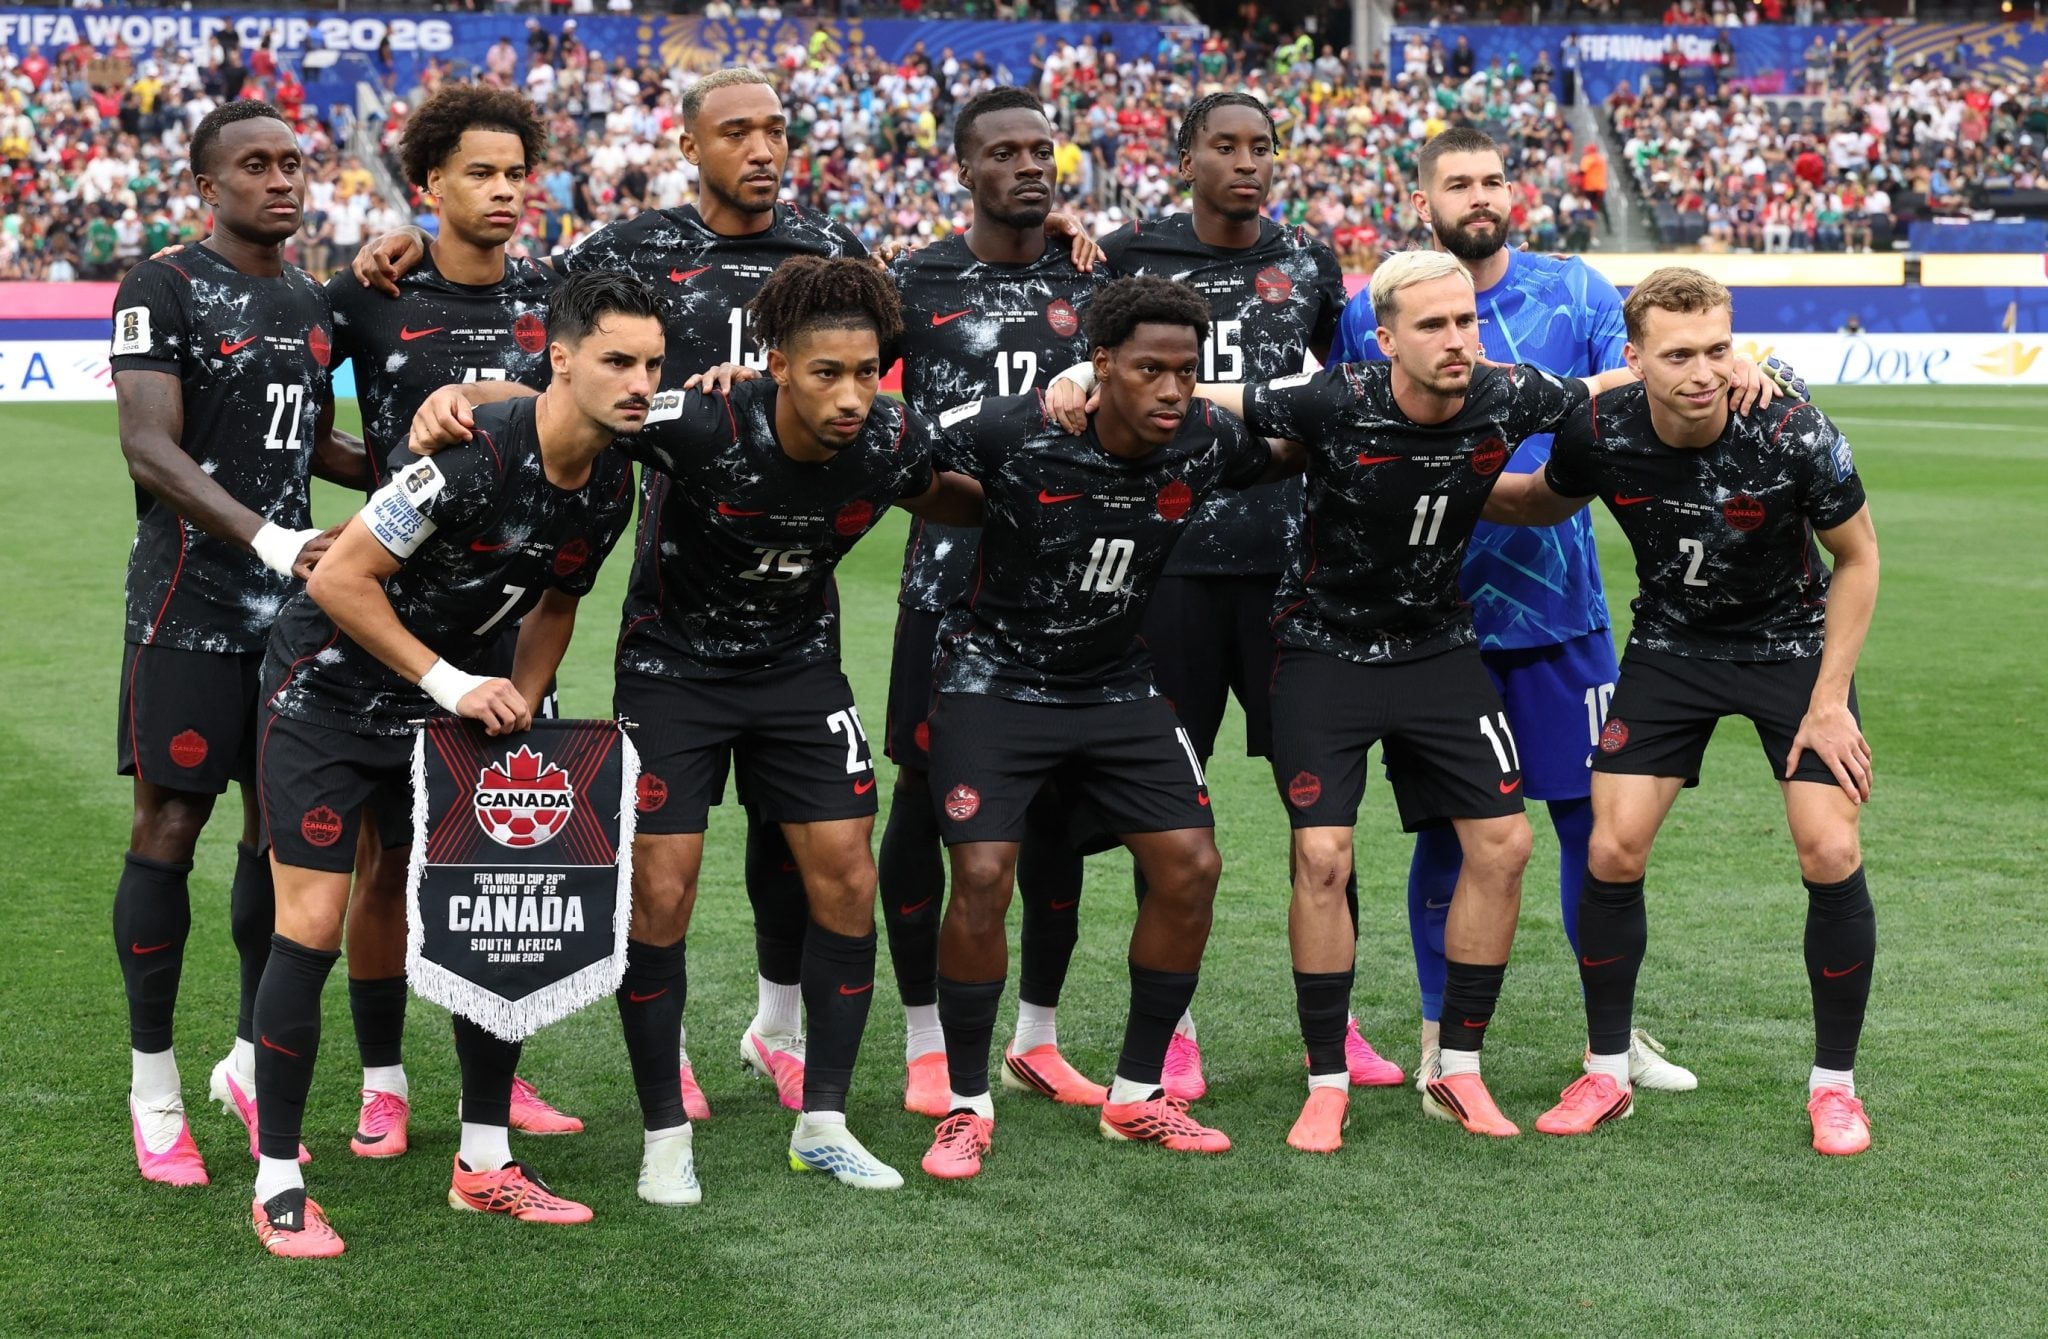
It’s a two-game Round of 16 slate on Saturday, opening with the Canadian men’s national team playing their biggest game ever against Morocco in Houston, Texas.
Elks vs. Lions Prediction: CFL Week 5 Point Spread, Odds
Edmonton has dropped 11 of 12 to the Lions including each of the past three, and have covered the spread just twice during that dismal 1-11-0 SU run.

Minnesota Lynx v. New York Liberty WNBA preview and prediction
Two of the WNBA’s best square off Friday at Barclays Center when the league-leading Minnesota Lynx face the New York Liberty at 7:30 p.m. ET.

-
Kevin Thompkins
Milwaukee Brewers vs. Arizona Diamondbacks: Odds, Prediction
Friday is the first of a three-game weekend set at Chase Field between the Milwaukee Brewers (53-32) and the Arizona Diamondbacks (43-43).

Tampa Bay Rays vs. Houston Astros: Odds, Prediction
Two red-hot clubs kick off a Fourth of July series as the Tampa Bay Rays (51-33, 1st in the AL Central) visit the Houston Astros (43-46, 3rd in the AL Central).

Canada vs. Morocco Round of 16 Prediction: FIFA World Cup Odds, Betting Picks
Canada will look to continue making history when they face Morocco in the World Cup Round of 16 on Saturday afternoon.
FIFA World Cup Canada vs. Morocco: Will Cyle Larin or Tani Oluwaseyi start next to Jonathan David?
Cyle Larin and Tani Oluwaseyi have each started games next to Jonathan David at this year’s World Cup.

World Cup 2026 odds: Paraguay vs. France Round of 16 prediction, betting picks
France are -575 favourites to win in 90 minutes, the draw is priced at +600 and Paraguay are +1800 underdogs.

FIFA World Cup Betting Picks for July 3: Lionel Messi continues Golden Boot chase
It’s the final chance for teams to book their ticket to the Round of 32 at the 2026 FIFA World Cup on Friday.

Norway vs. Brazil Round of 16 Prediction: FIFA World Cup Betting Odds and Picks
FIFA World Cup Round of 16 Betting Picks for July 4: Jonathan David poised to find the net
Elks vs. Lions Prediction: CFL Week 5 Point Spread, Odds
Minnesota Lynx v. New York Liberty WNBA preview and prediction
-
Milwaukee Brewers vs. Arizona Diamondbacks: Odds, Prediction
Tampa Bay Rays vs. Houston Astros: Odds, Prediction
Canada vs. Morocco Round of 16 Prediction: FIFA World Cup Odds, Betting Picks
FIFA World Cup Canada vs. Morocco: Will Cyle Larin or Tani Oluwaseyi start next to Jonathan David?
World Cup 2026 odds: Paraguay vs. France Round of 16 prediction, betting picks
FIFA World Cup Betting Picks for July 3: Lionel Messi continues Golden Boot chase


