CFL Week 7 Power Rankings: Winless RedBlacks hit rock bottom
We’re six weeks into the 2026 CFL season and the gap is widening in the standings.

CF Montreal vs. Toronto FC Preview: MLS Odds and Prediction
After a long layoff, MLS action resumes on Thursday night with CF Montreal hosting Toronto FC in the 66th iteration of the Canadian Classique.

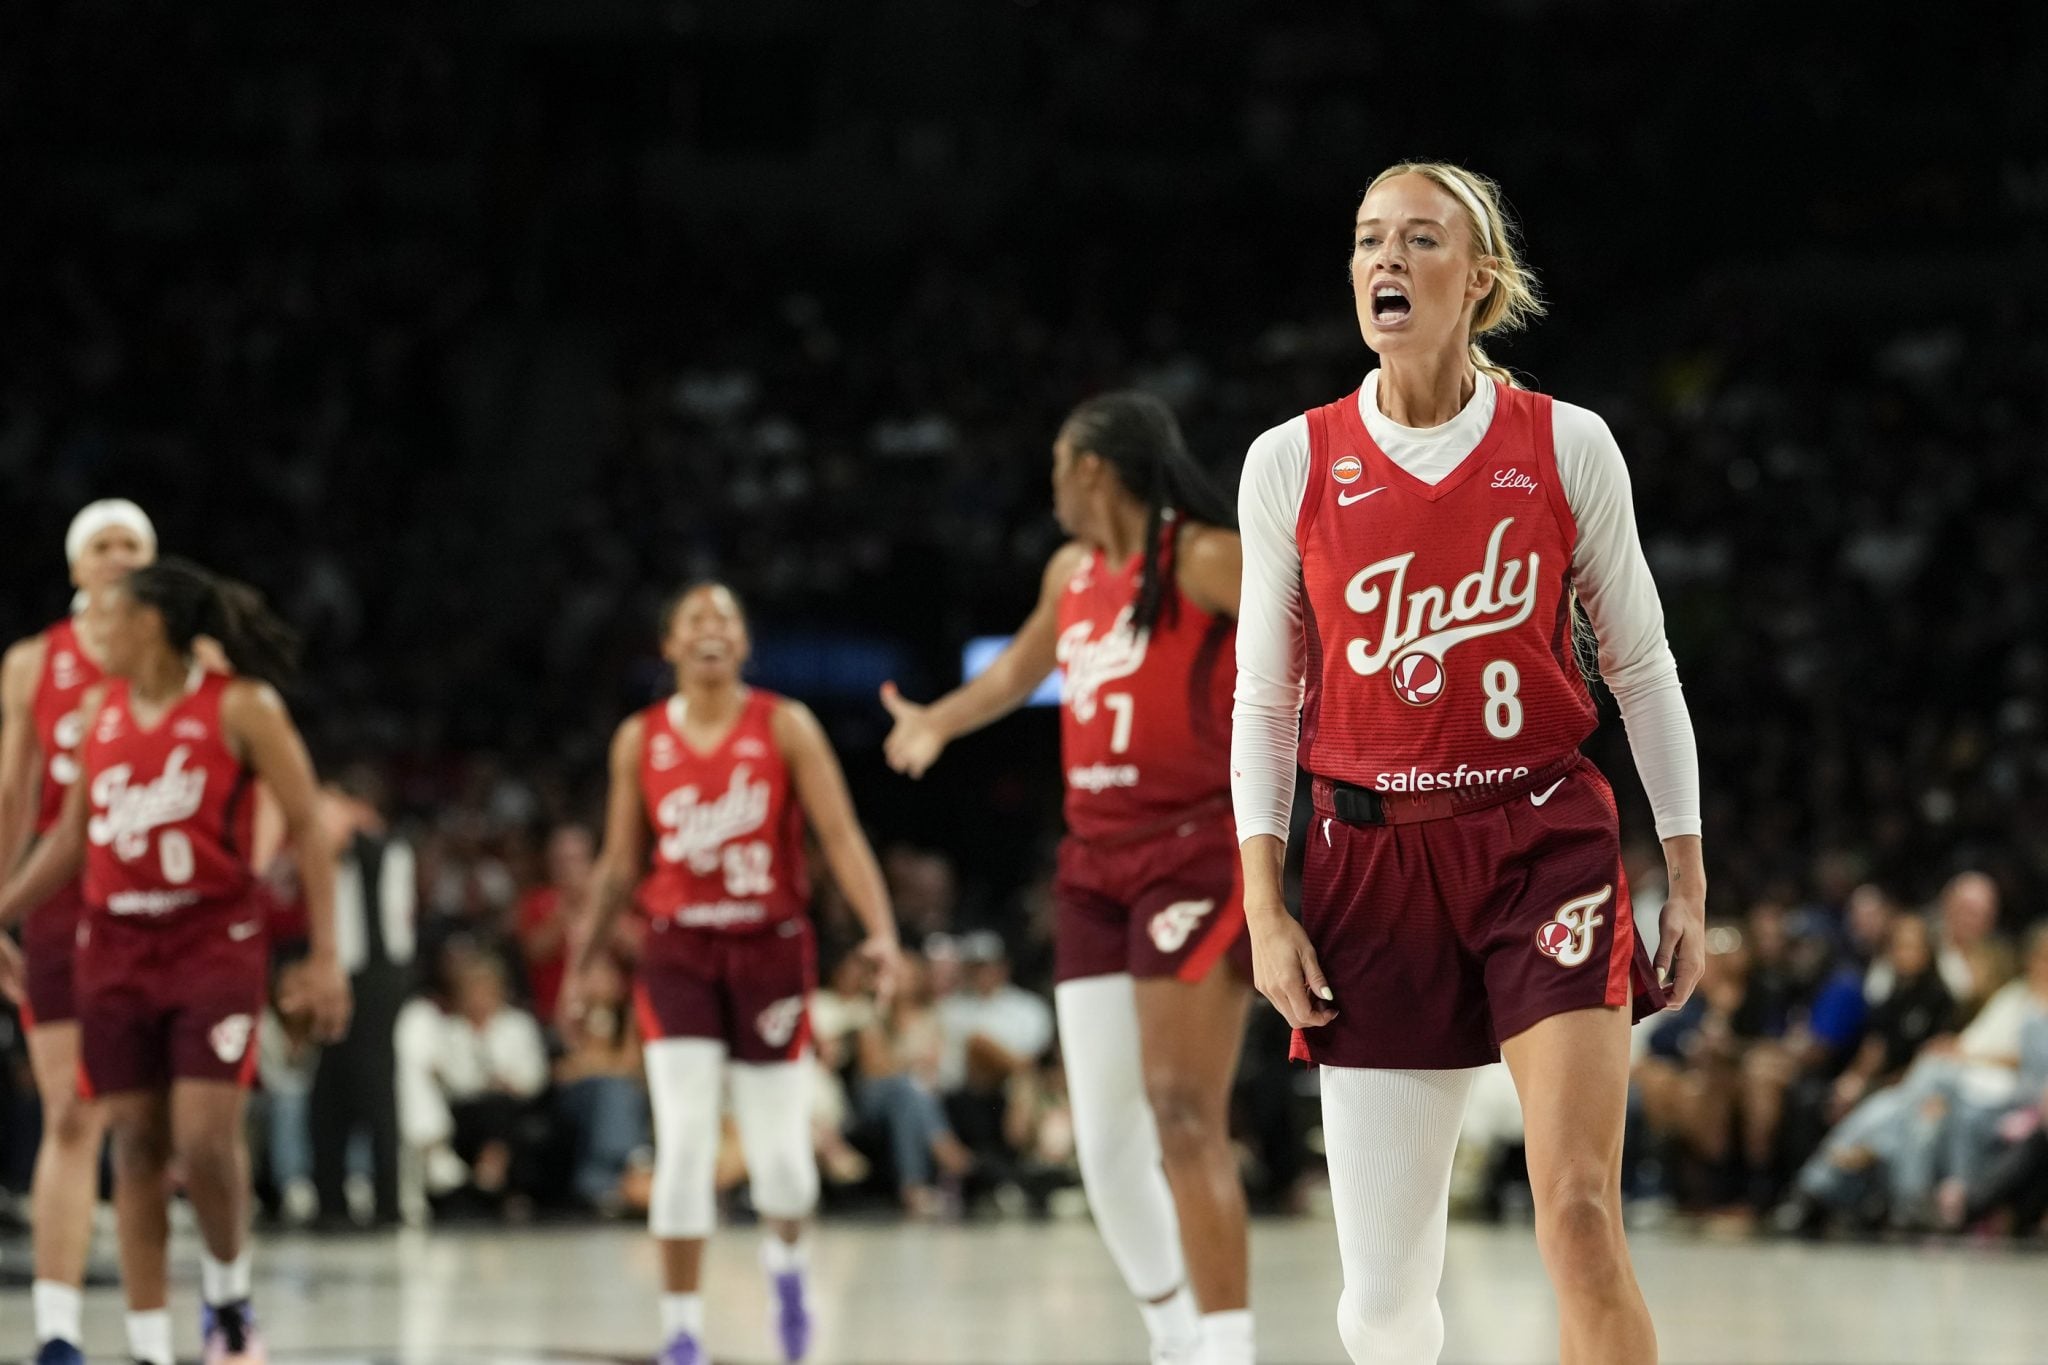
Golden State Valkyries vs. Indiana Fever: WNBA Preview and Prediction
At 8pm on Wednesday, WNBA fans will be treated to a clash between two of the league’s best: the Golden State Valkyries (17-7) and the Indiana Fever (14-9).
2026 British Open PGA Tour Betting Odds: Can Tommy Fleetwood secure his first career major?
The Grand Slam portion of the golf season comes to an end this week at the 154th British Open, which tees off at Royal Birkdale Golf Club in North West England

The Open Championship predictions, best bets and golf odds
It’s the fourth and final major of the 2026 season this week at Royal Birkdale Golf Club in North West England

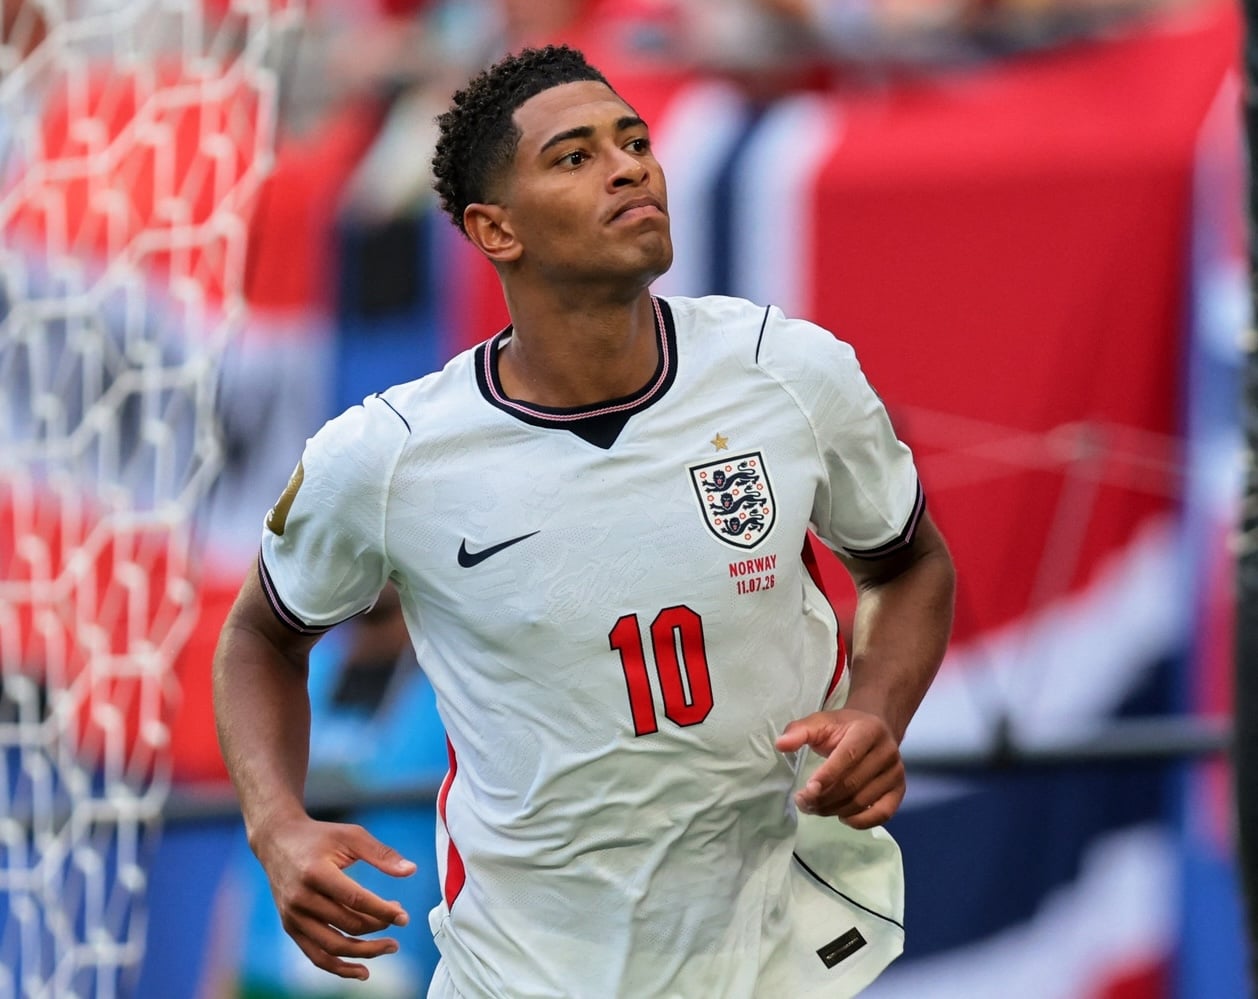
England vs. Argentina Semifinal Prediction: FIFA World Cup Odds, Betting Picks
England will aim to reach the World Cup final for the first time in 60 years when they meet defending champion Argentina in the tournament’s second semifinal on Wednesday.
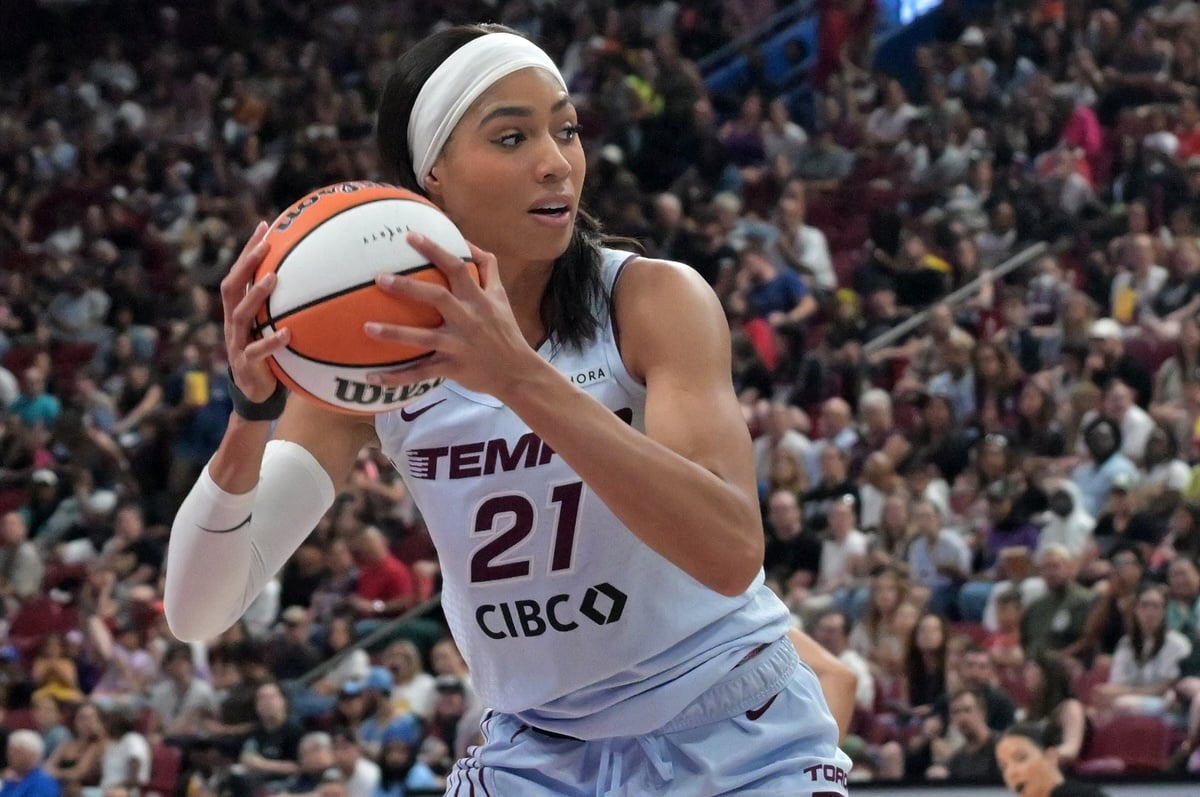
Washington Mystics vs. Toronto Tempo WNBA preview and prediction
Crucial playoff implications will be on the line when the Tempo and Mystics meet in Toronto on Tuesday night.
France vs. Spain Semifinal Prediction: FIFA World Cup Odds, Betting Picks
France is headed to the semifinals for a third straight World Cup as they prepare to face European champions Spain on Tuesday.

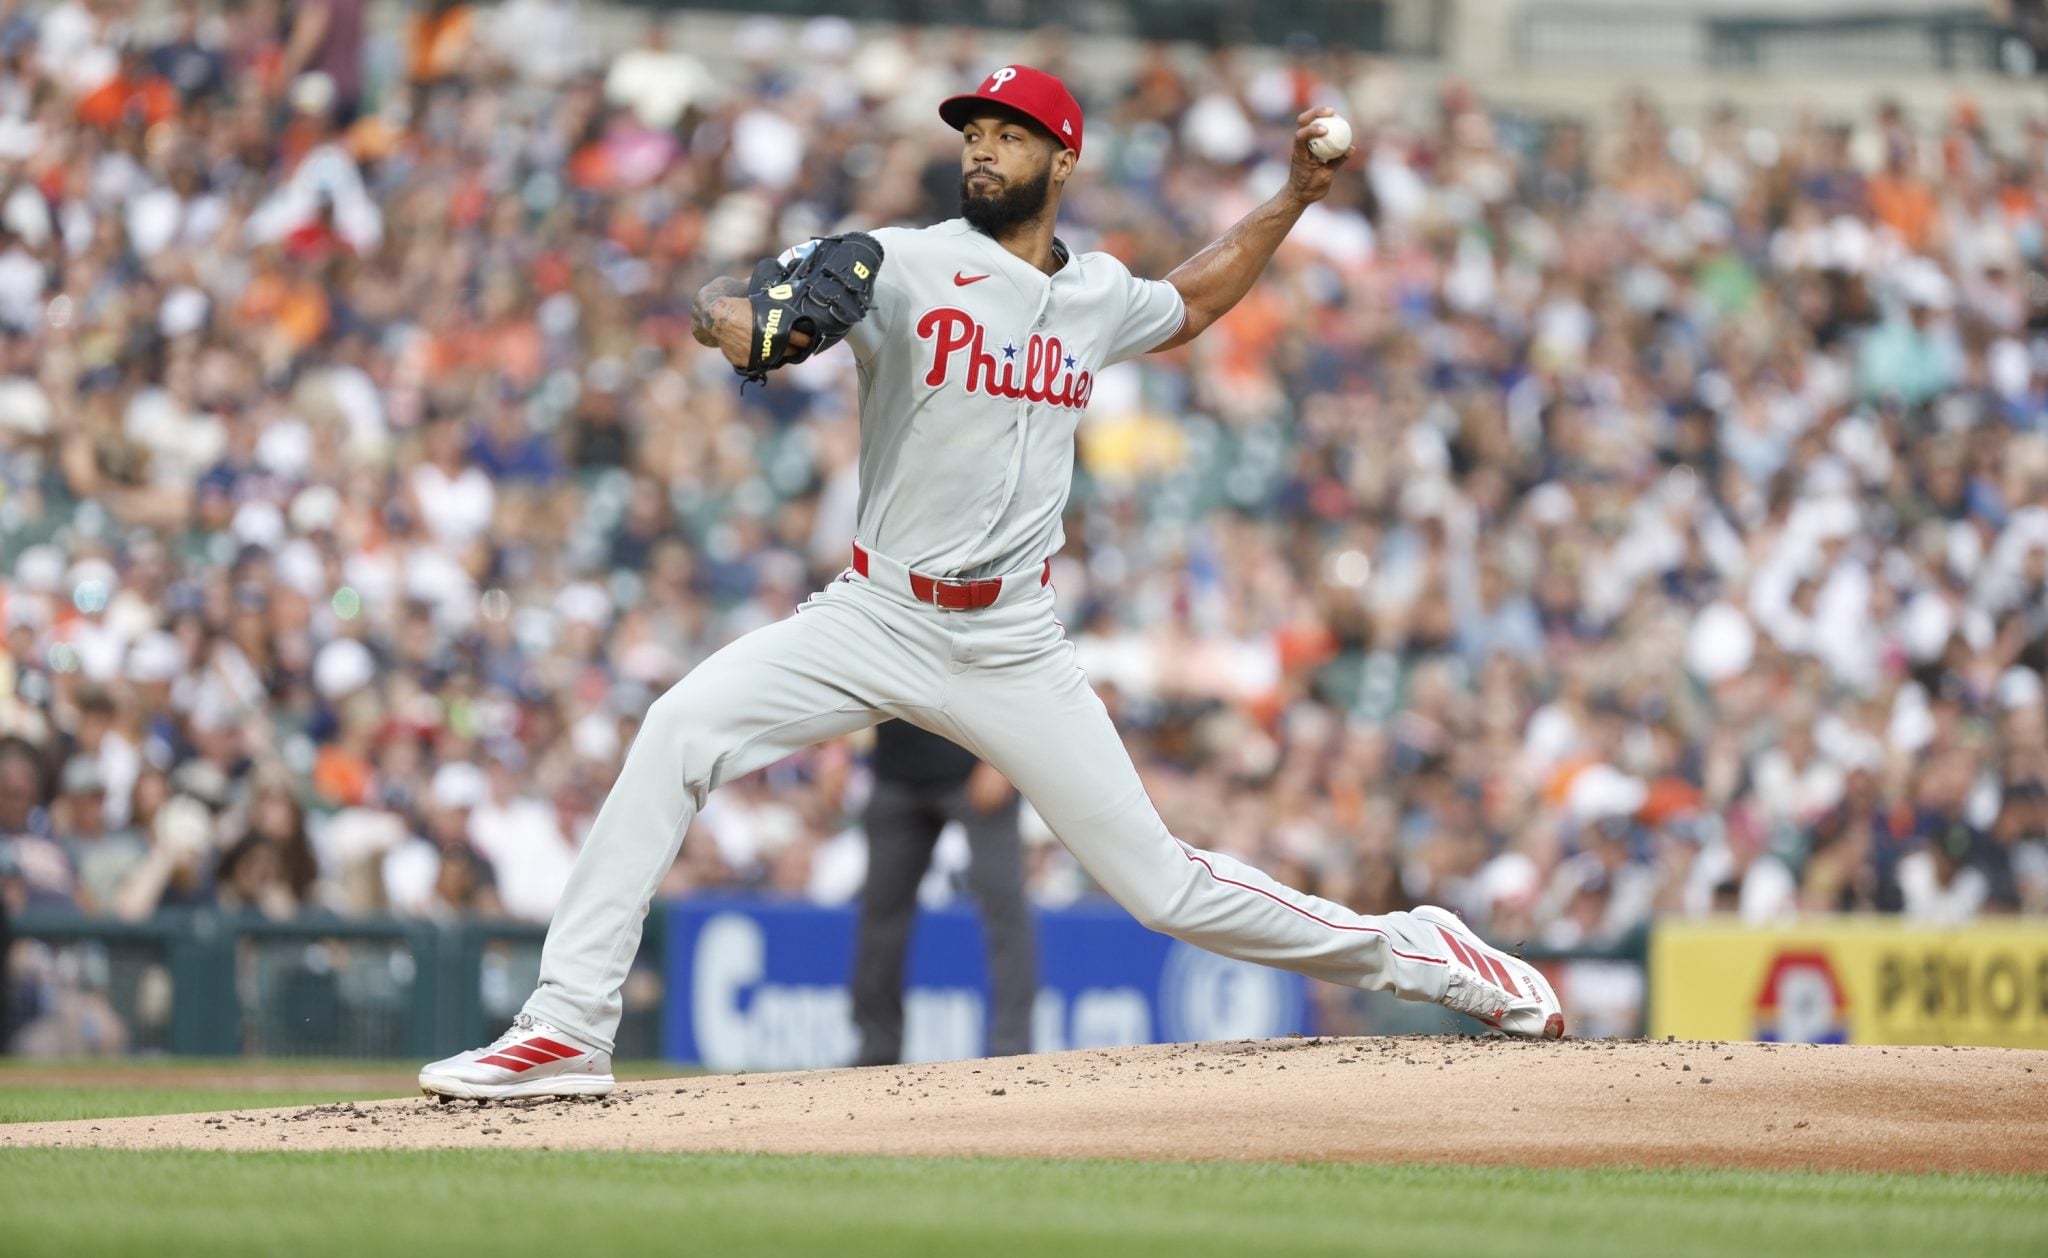
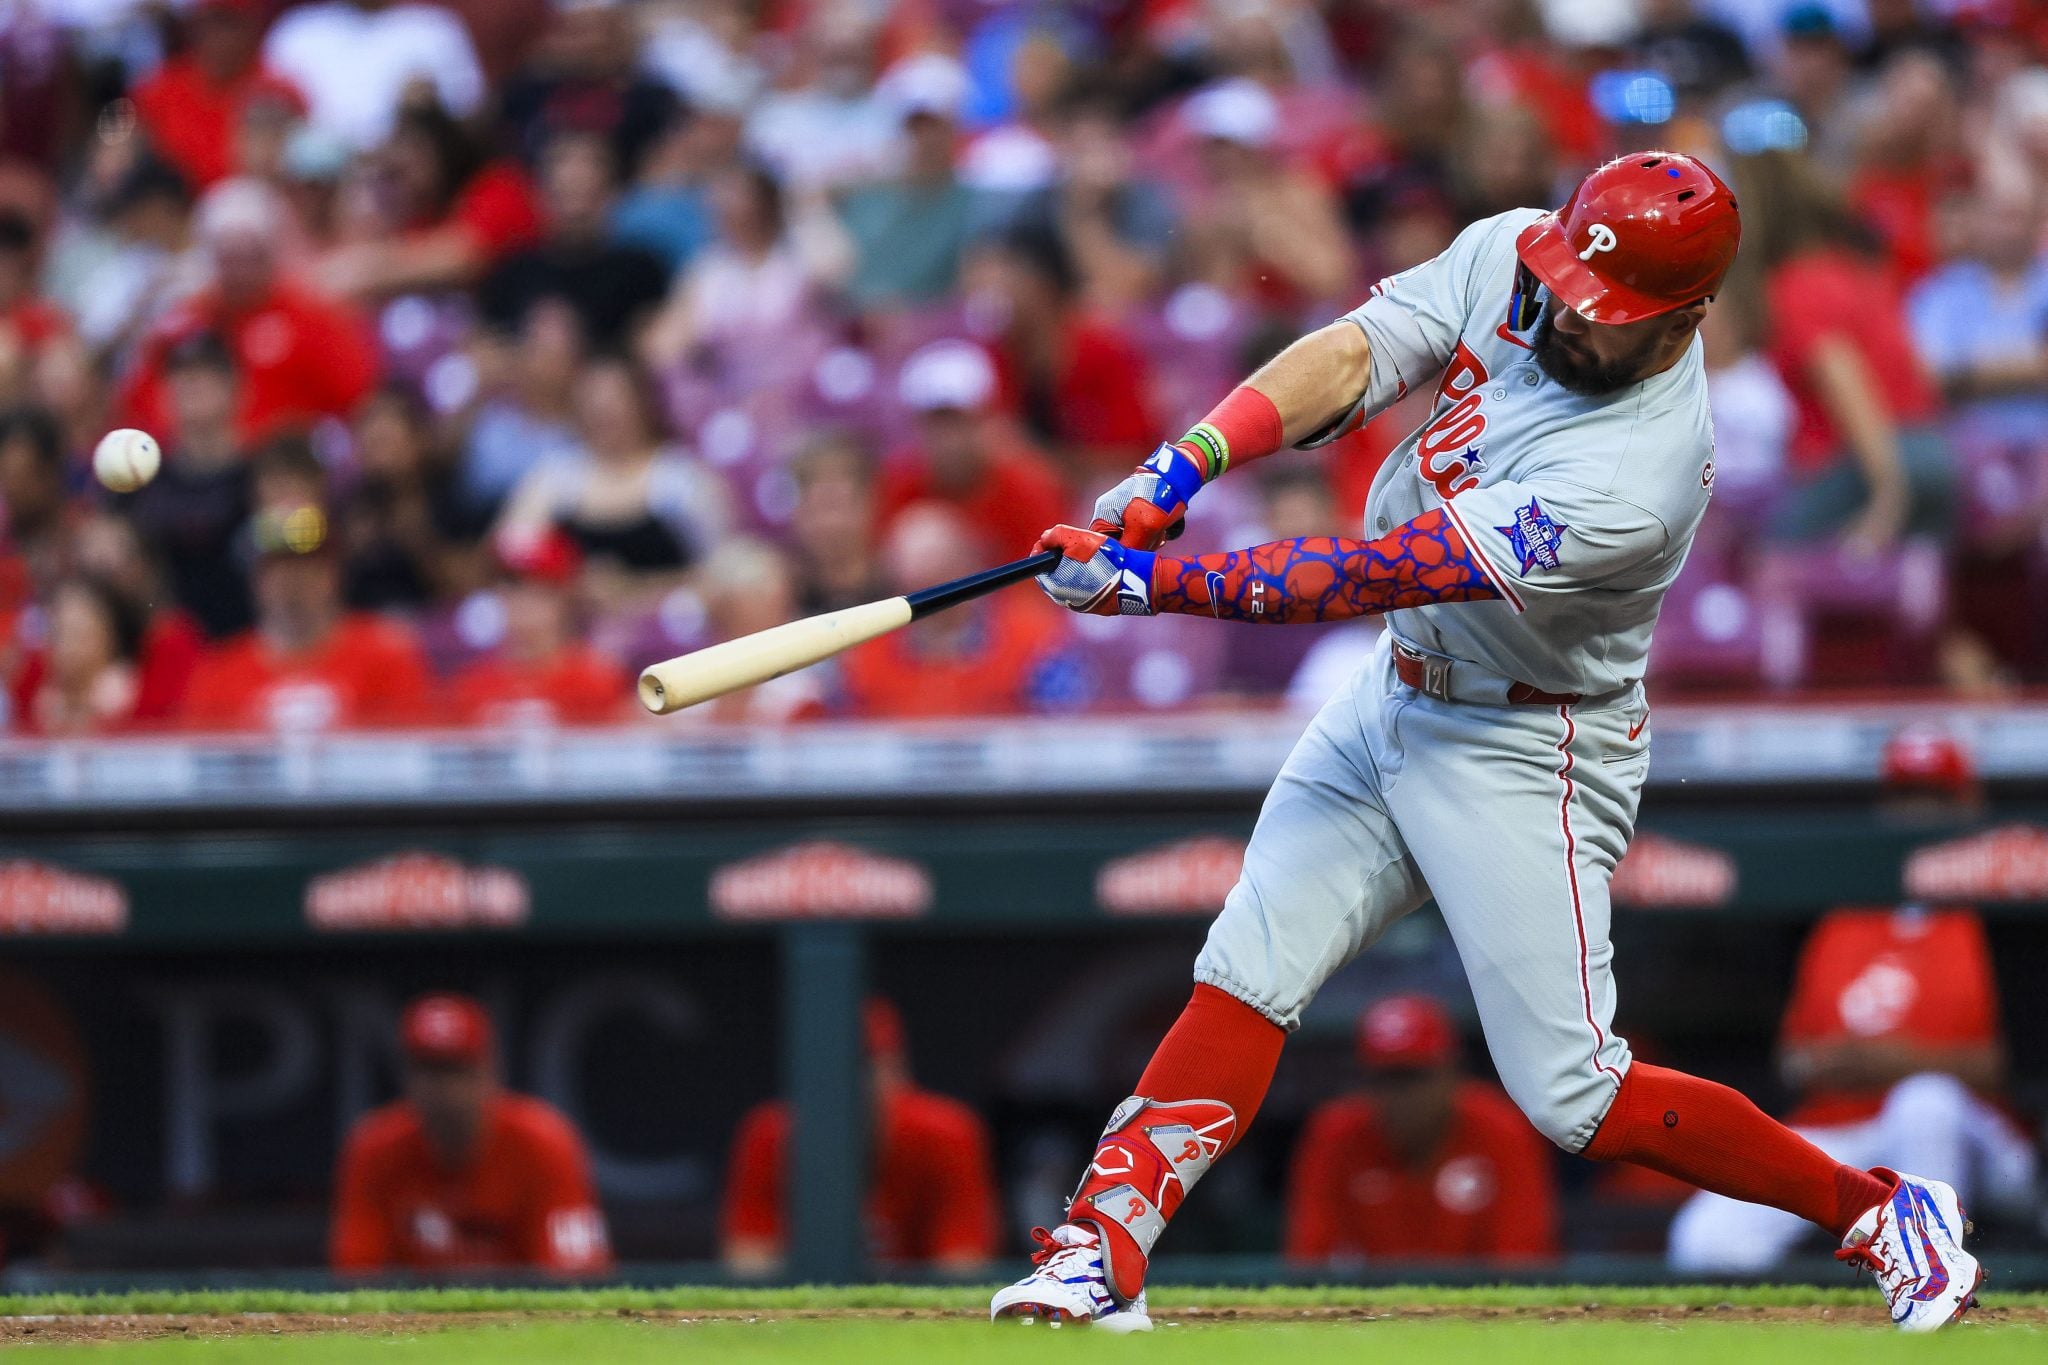
American League vs. National League MLB All-Star Game Preview and Prediction
The 96th MLB All-Star Game heads to Citizens Bank Park in Philadelphia on Tuesday night, with the National League serving as the home team in front of what should be an electric Phillies-heavy crowd.
-
Kevin Tompkins
2026 MLB Home Run Derby Rules, Odds, Betting Predictions
The 2026 MLB Home Derby favors prodigious power over endurance, so it really opens up the field tonight.
CFL Week 7 Power Rankings: Winless RedBlacks hit rock bottom
CF Montreal vs. Toronto FC Preview: MLS Odds and Prediction
Golden State Valkyries vs. Indiana Fever: WNBA Preview and Prediction
2026 British Open PGA Tour Betting Odds: Can Tommy Fleetwood secure his first career major?
The Open Championship predictions, best bets and golf odds
England vs. Argentina Semifinal Prediction: FIFA World Cup Odds, Betting Picks
Washington Mystics vs. Toronto Tempo WNBA preview and prediction
France vs. Spain Semifinal Prediction: FIFA World Cup Odds, Betting Picks
American League vs. National League MLB All-Star Game Preview and Prediction
-
2026 MLB Home Run Derby Rules, Odds, Betting Predictions


