South Africa vs. Canada Prediction: FIFA World Cup Odds, Betting Picks
The Round of 32 at the 2026 FIFA World Cup kicks off Sunday with co-host Canada facing South Africa at SoFi Stadium in Los Angeles.

RedBlacks vs. Alouettes Prediction: CFL Week 4 Point Spread, Odds
The RedBlacks aim to claim their first road win since last summer when they visit the Alouettes on Sunday night at Percival Molson Stadium.

Stampeders vs. Lions Prediction: CFL Week 4 Point Spread, Odds
A clash of CFL West rivals still searching for their first win of the season highlights the Saturday night sports betting schedule as the BC Lions play host to the Calgary Stampeders at Apple Bowl Stadium in Kelowna.

Panama vs. England prediction: 2026 World Cup betting odds, picks
England coach Thomas Tuchel’s England side left two points on the table against Ghana. They’ll look to get all three on Saturday.

Croatia vs. Ghana prediction: World Cup 2026 odds, betting picks
Croatia comes in as the favourite at -134 on the three-way money line. Ghana sits as an underdog at +450, with the draw around +230.

Algeria vs. Austria Prediction: FIFA World Cup Odds, Betting Picks
Austria will look to clinch a spot in the Round of 32 when they close out the group stage against Algeria on Saturday night.

Jordan vs. Argentina Prediction: FIFA World Cup Odds, Betting Picks
Defending champion Argentina have already locked up Group J ahead of their matchup against Jordan in Arlington, Texas on Saturday at 10 p.m. ET.

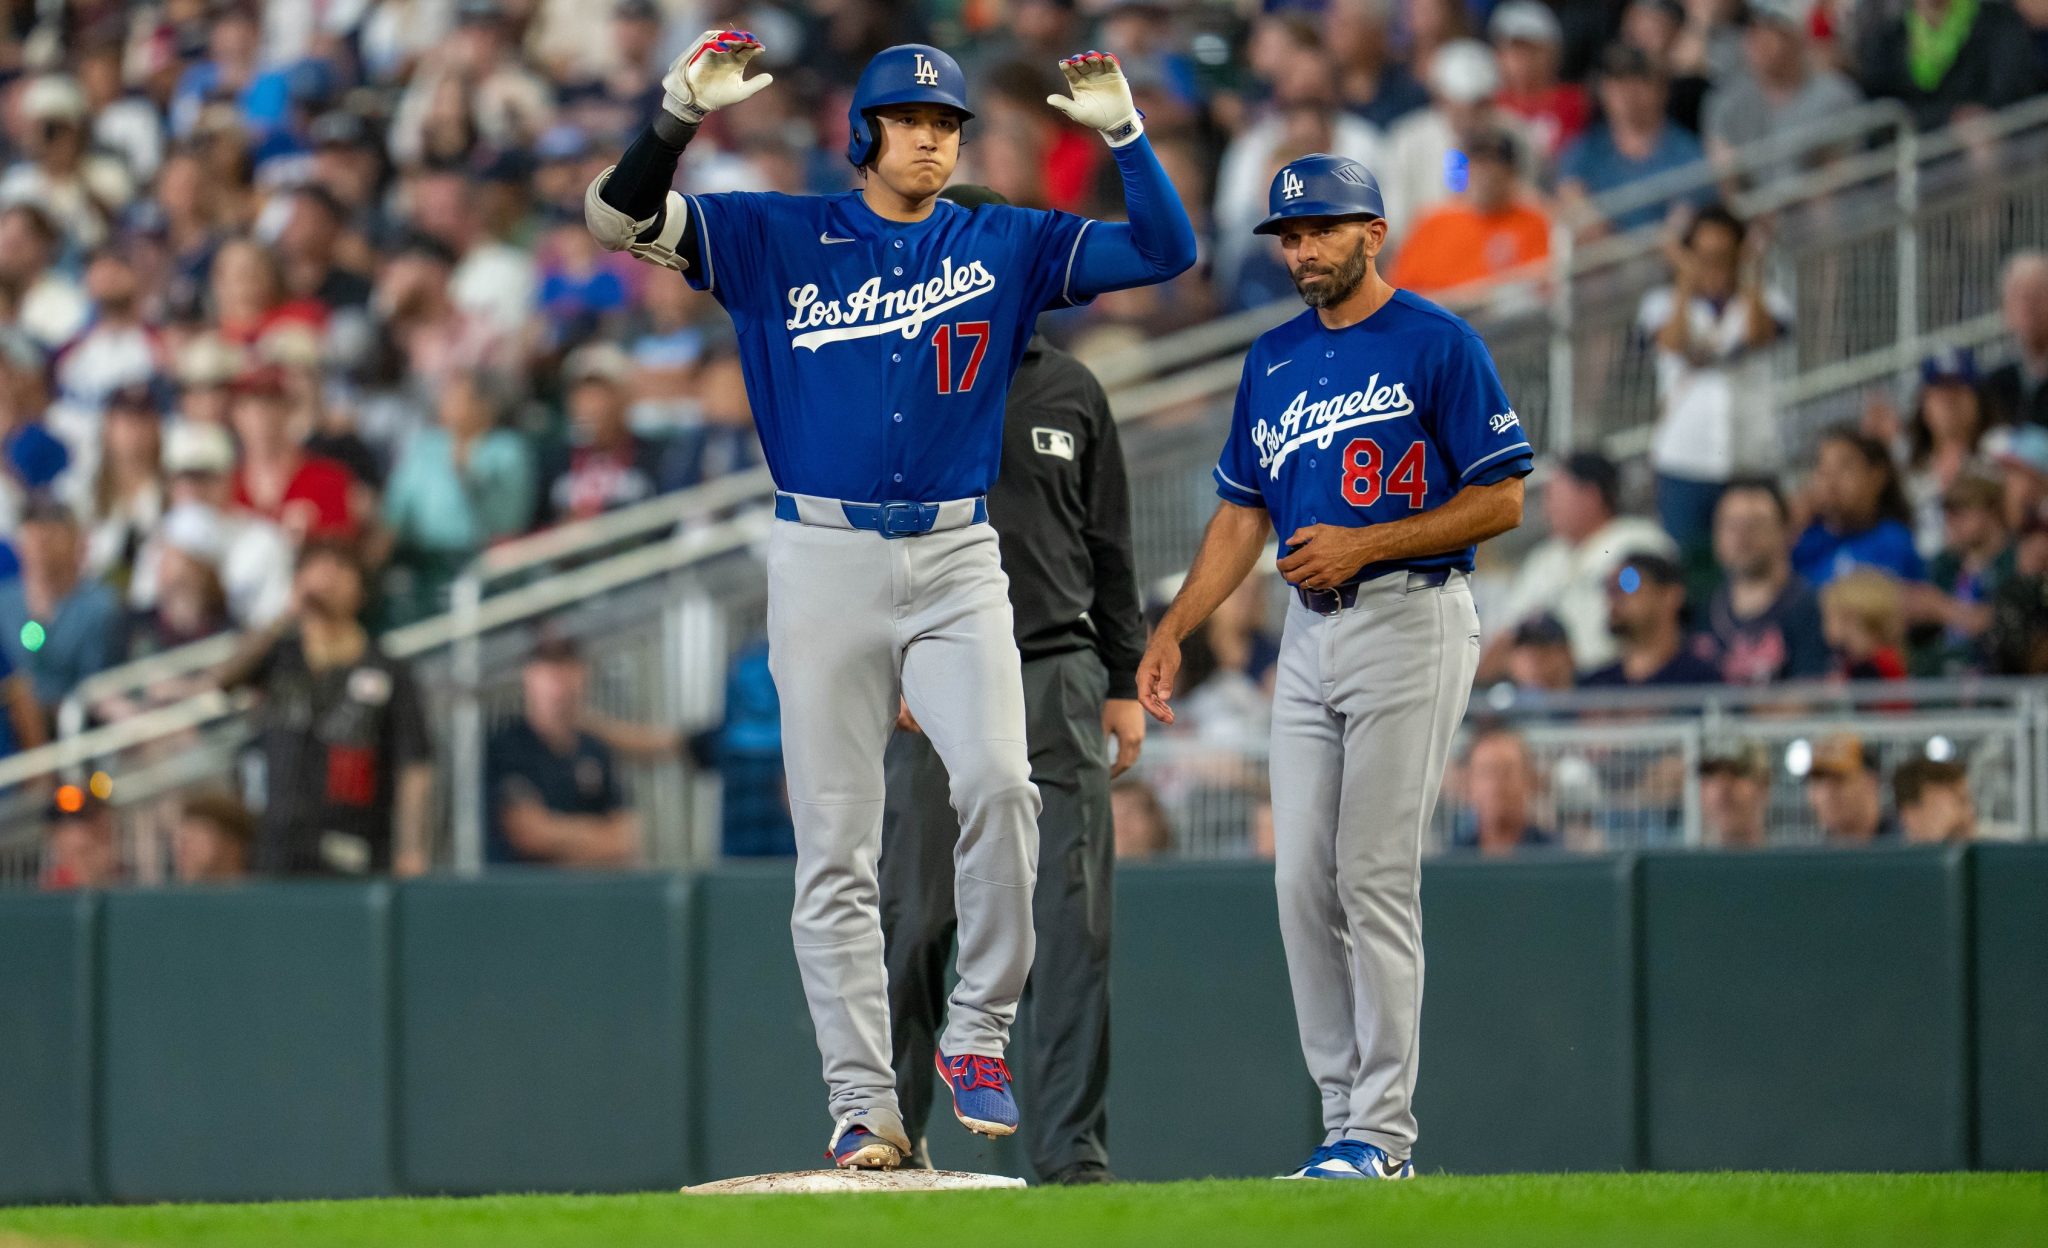
Los Angeles Dodgers vs. San Diego Padres: Odds, Prediction
A full MLB slate is scheduled for Friday, which will include a National League West division rivalry between the Los Angeles Dodgers and San Diego Padres.
DR Congo vs. Uzbekistan World Cup prediction and betting odds
DR Congo have found success in their standard by playing a five-back, allowing only one late goal this entire tournament.

-
Kevin Thompkins
Chicago Cubs vs. Milwaukee Brewers: Odds, Prediction
The Chicago Cubs (44-37) travel north up the coast of Lake Michigan on Friday to face the Milwaukee Brewers (49-29) in the first of a three-game NL Central weekend series.

South Africa vs. Canada Prediction: FIFA World Cup Odds, Betting Picks
RedBlacks vs. Alouettes Prediction: CFL Week 4 Point Spread, Odds
Stampeders vs. Lions Prediction: CFL Week 4 Point Spread, Odds
Panama vs. England prediction: 2026 World Cup betting odds, picks
Croatia vs. Ghana prediction: World Cup 2026 odds, betting picks
Algeria vs. Austria Prediction: FIFA World Cup Odds, Betting Picks
Jordan vs. Argentina Prediction: FIFA World Cup Odds, Betting Picks
Los Angeles Dodgers vs. San Diego Padres: Odds, Prediction
DR Congo vs. Uzbekistan World Cup prediction and betting odds
-
Chicago Cubs vs. Milwaukee Brewers: Odds, Prediction


