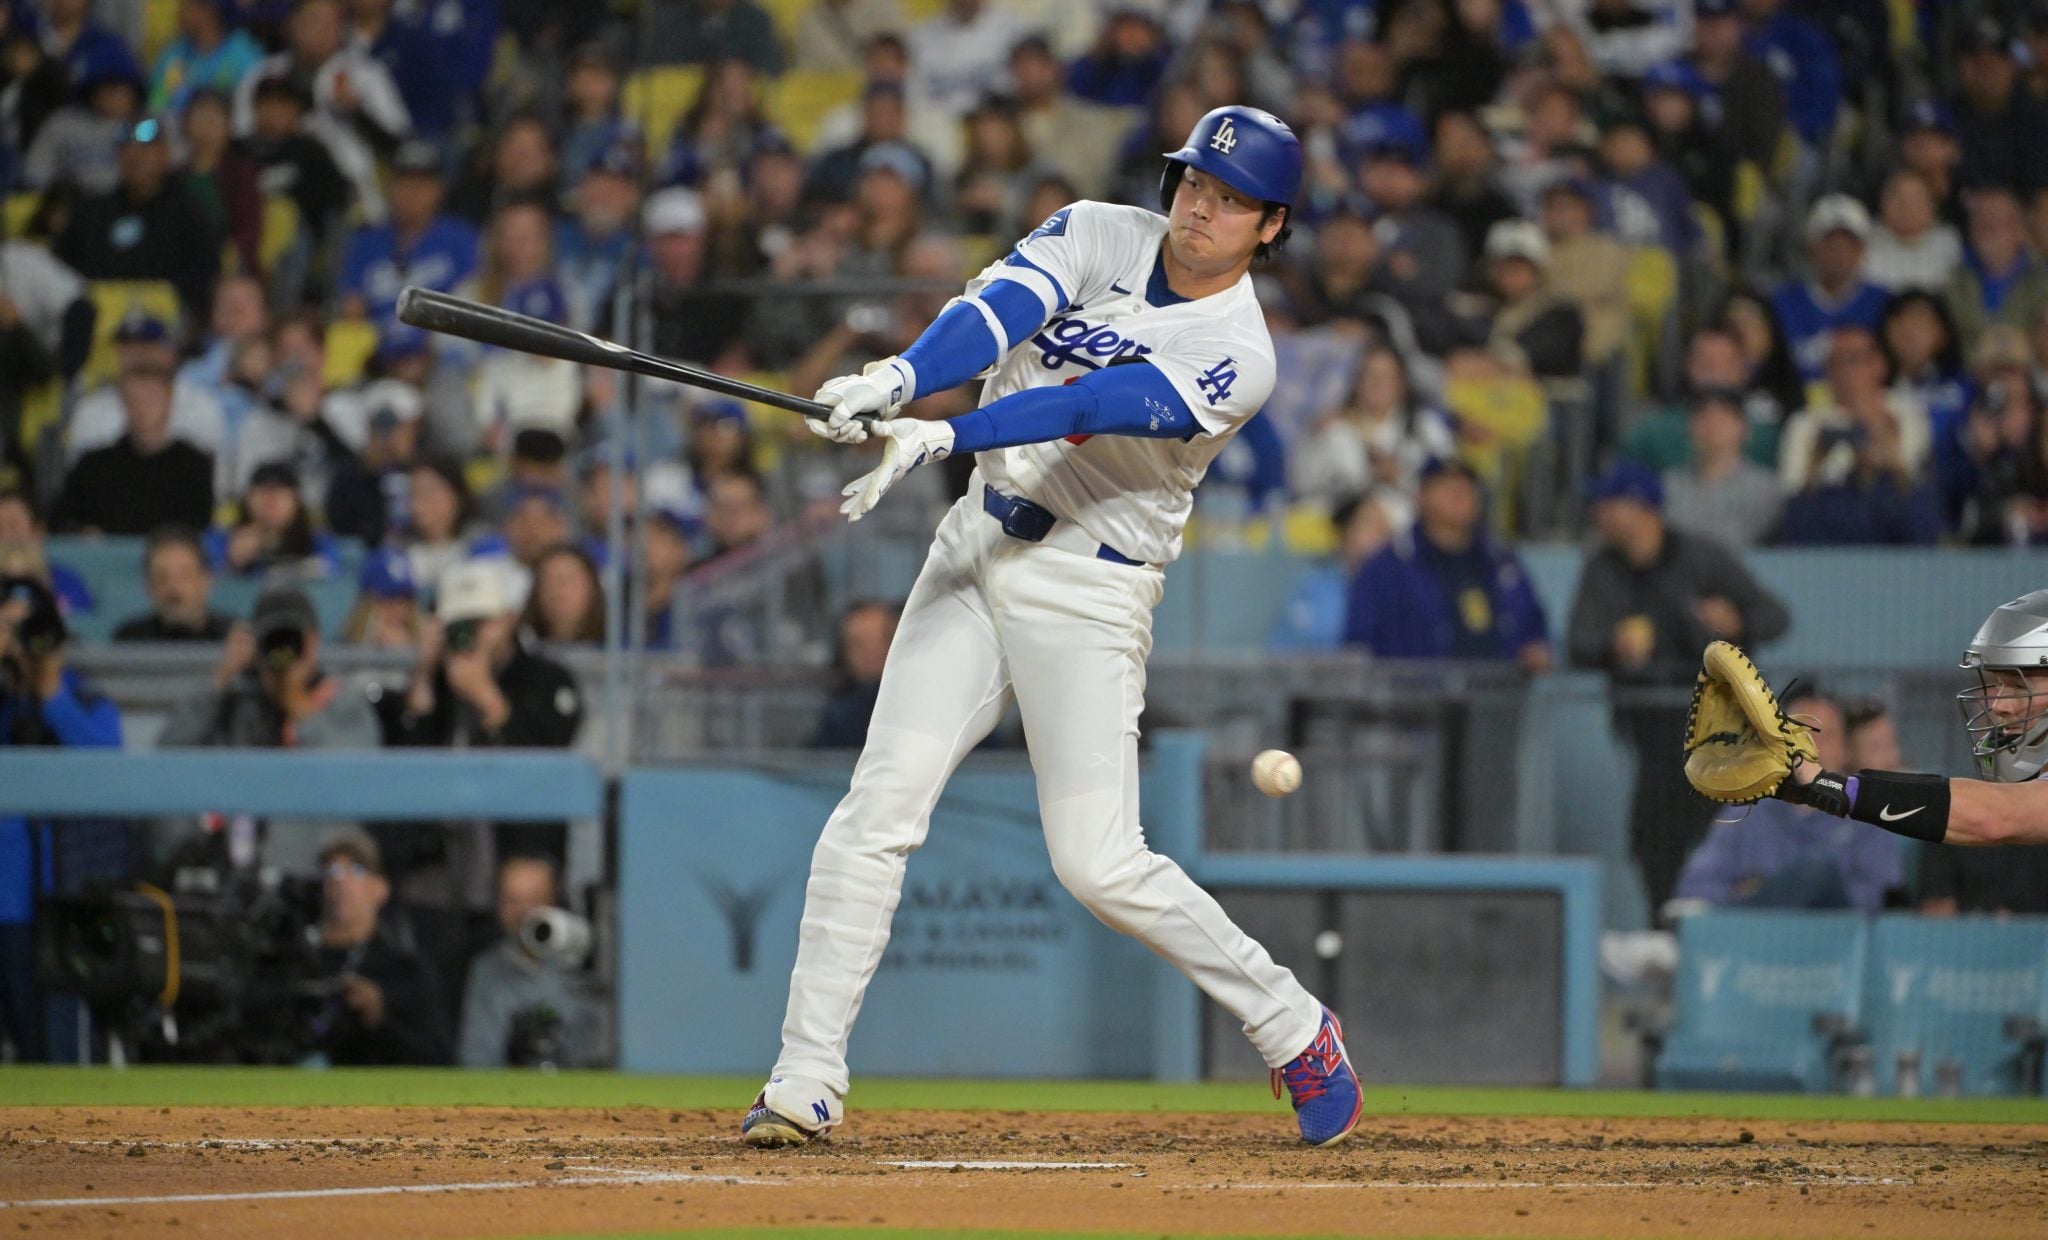
Philadelphia Phillies vs. Los Angeles Dodgers: Odds, Prediction
It’s a heavyweight National League battle on Friday as the Los Angeles Dodgers play host to the Philadelphia Phillies.
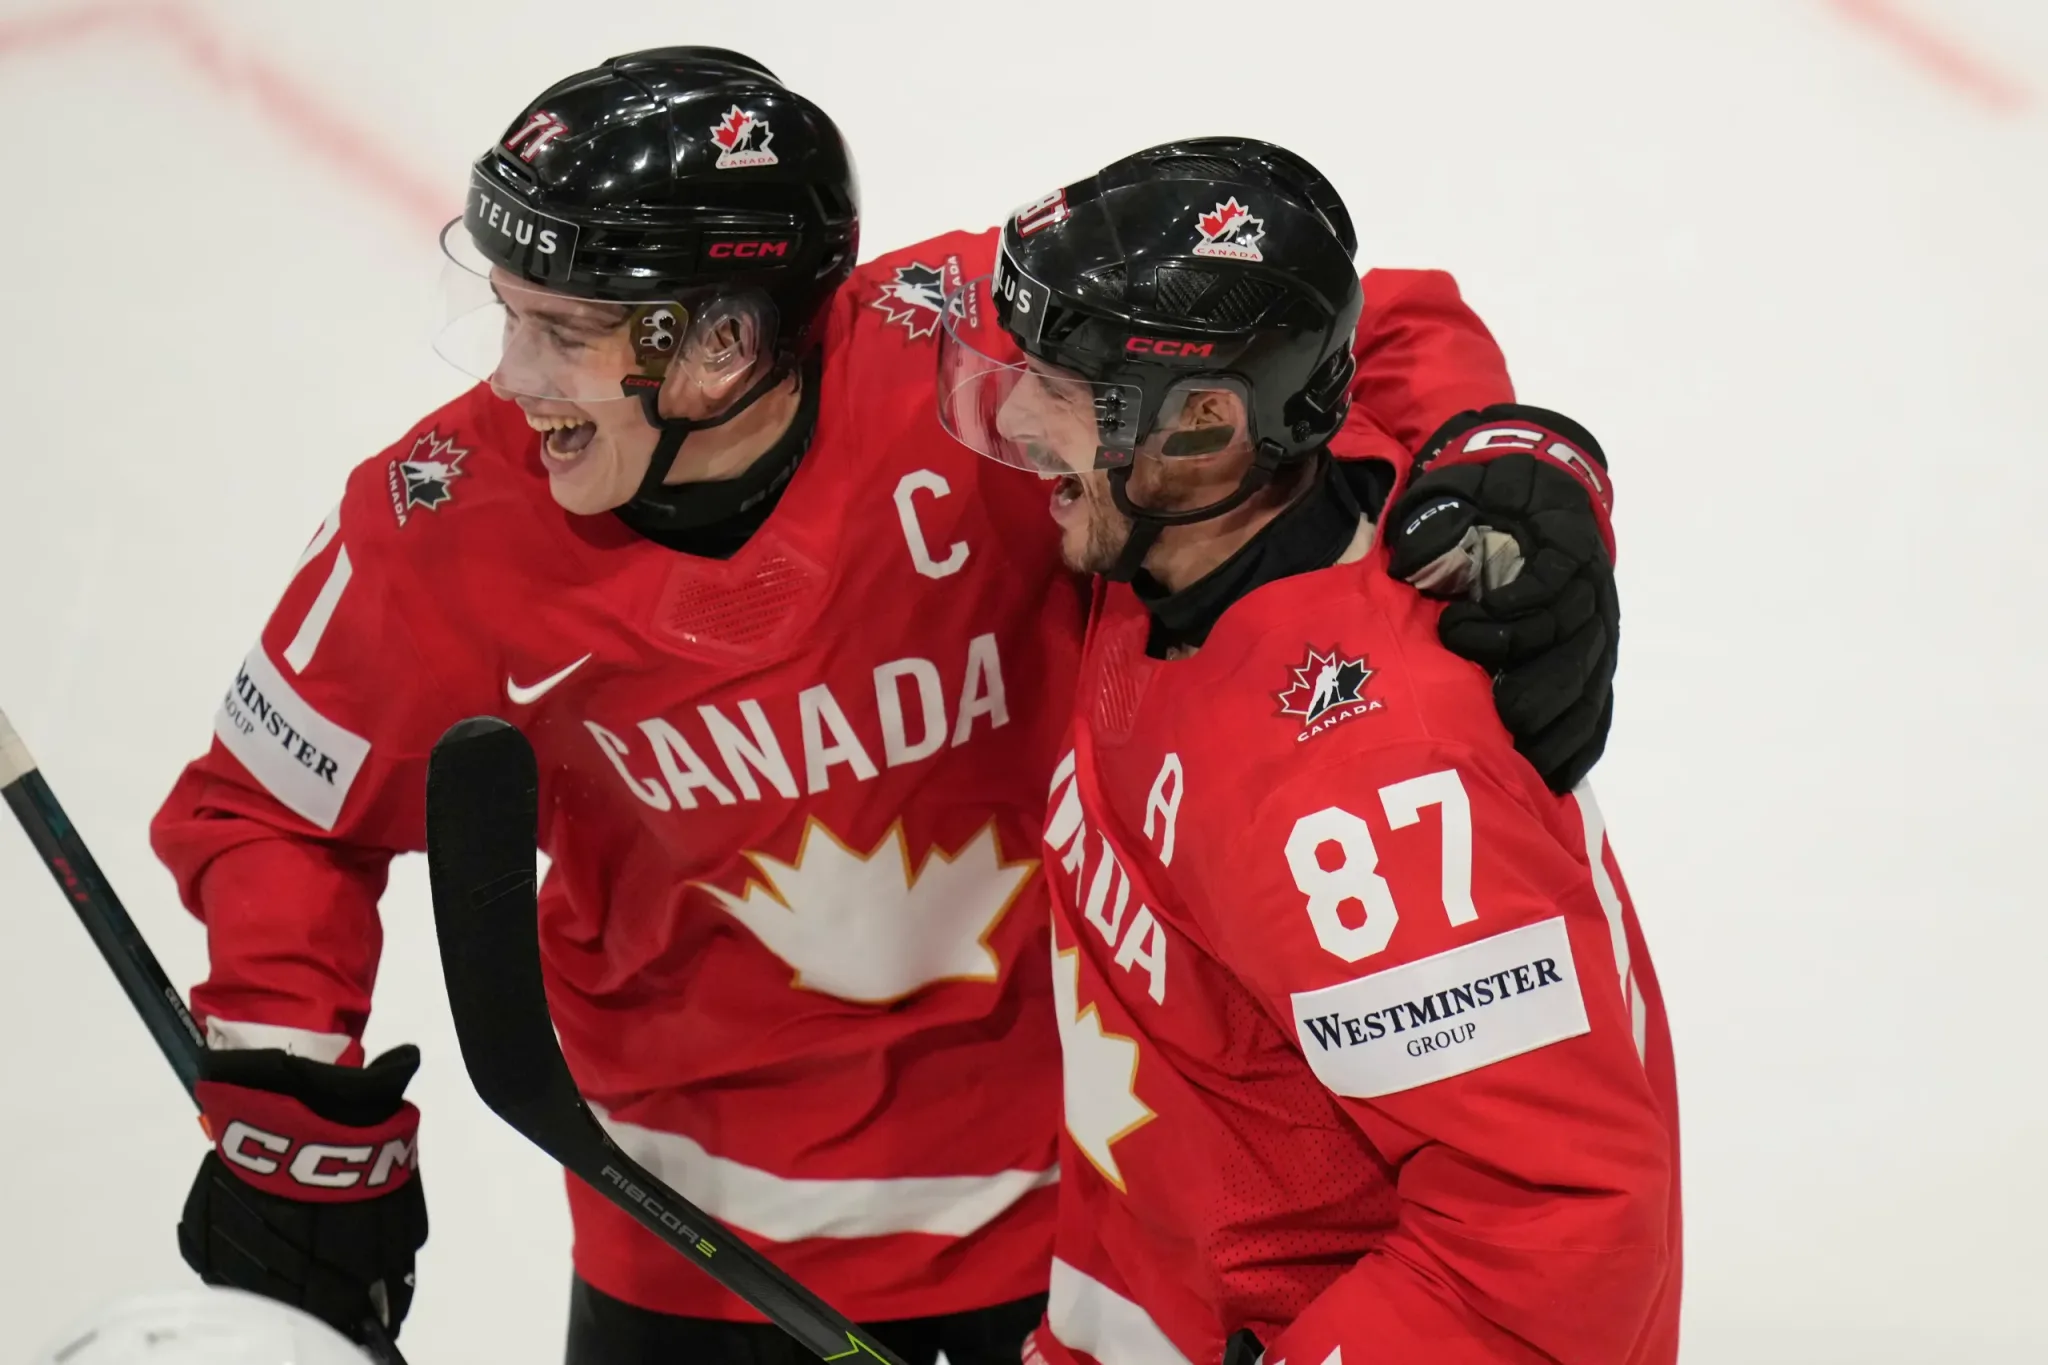
2026 IIHF Men’s World Championship Semifinal Odds, Prediction: Finland vs. Canada
Canada’s quest for gold at the 2026 IIHF World Championship continues on Saturday with a semifinal matchup against Finland.
Arsenal vs. PSG Champions League Final preview and prediction
It’s the Champions League Final on Saturday as English Premier League winners Arsenal take on defending UCL winners Paris Saint-Germain.

Canada set to unveil FIFA World Cup roster Friday at 7 p.m. ET
Canada is drawn into Group B for this year’s World Cup.

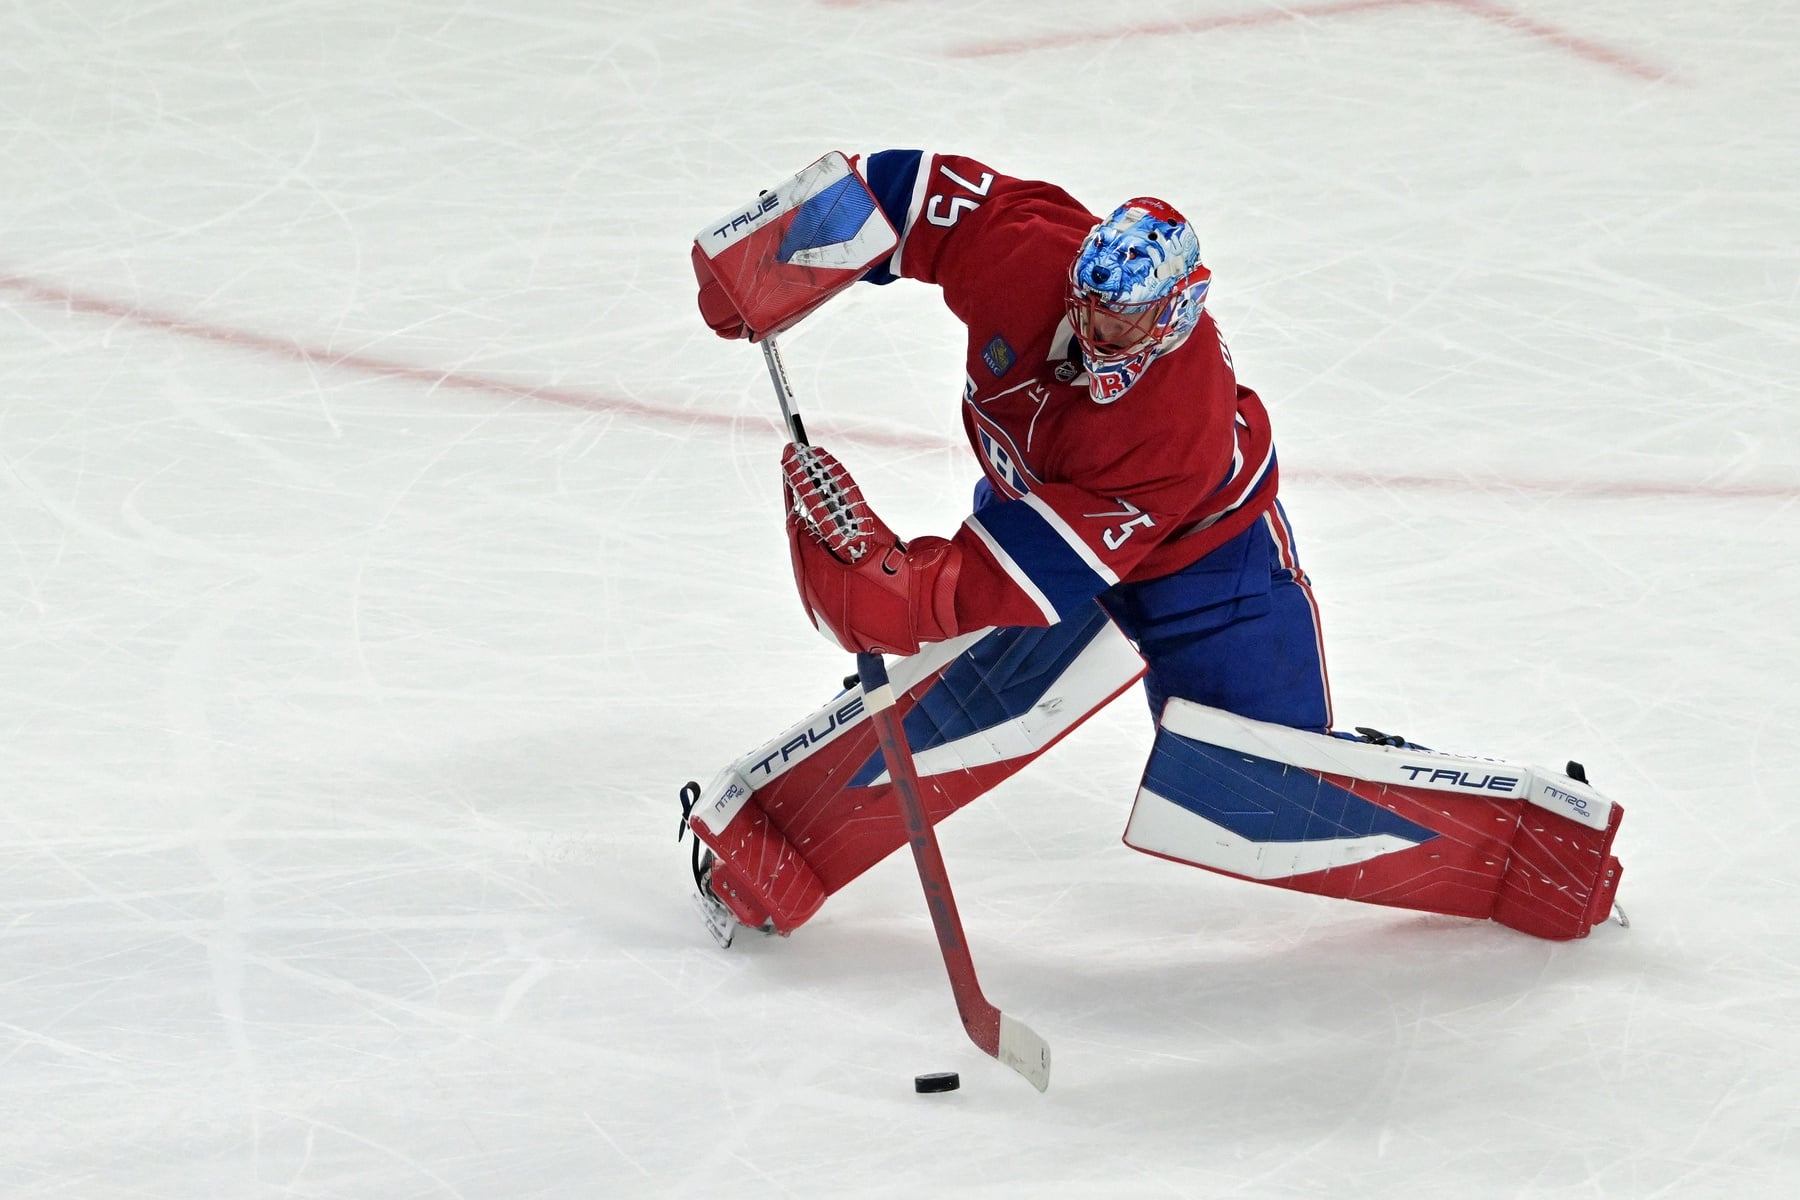
Montreal Canadiens vs. Carolina Hurricanes Game 5 Prediction, NHL Odds
The Montreal Canadiens’ season is on the line Friday night as they visit Carolina down 3-1 in the Eastern Conference Finals.
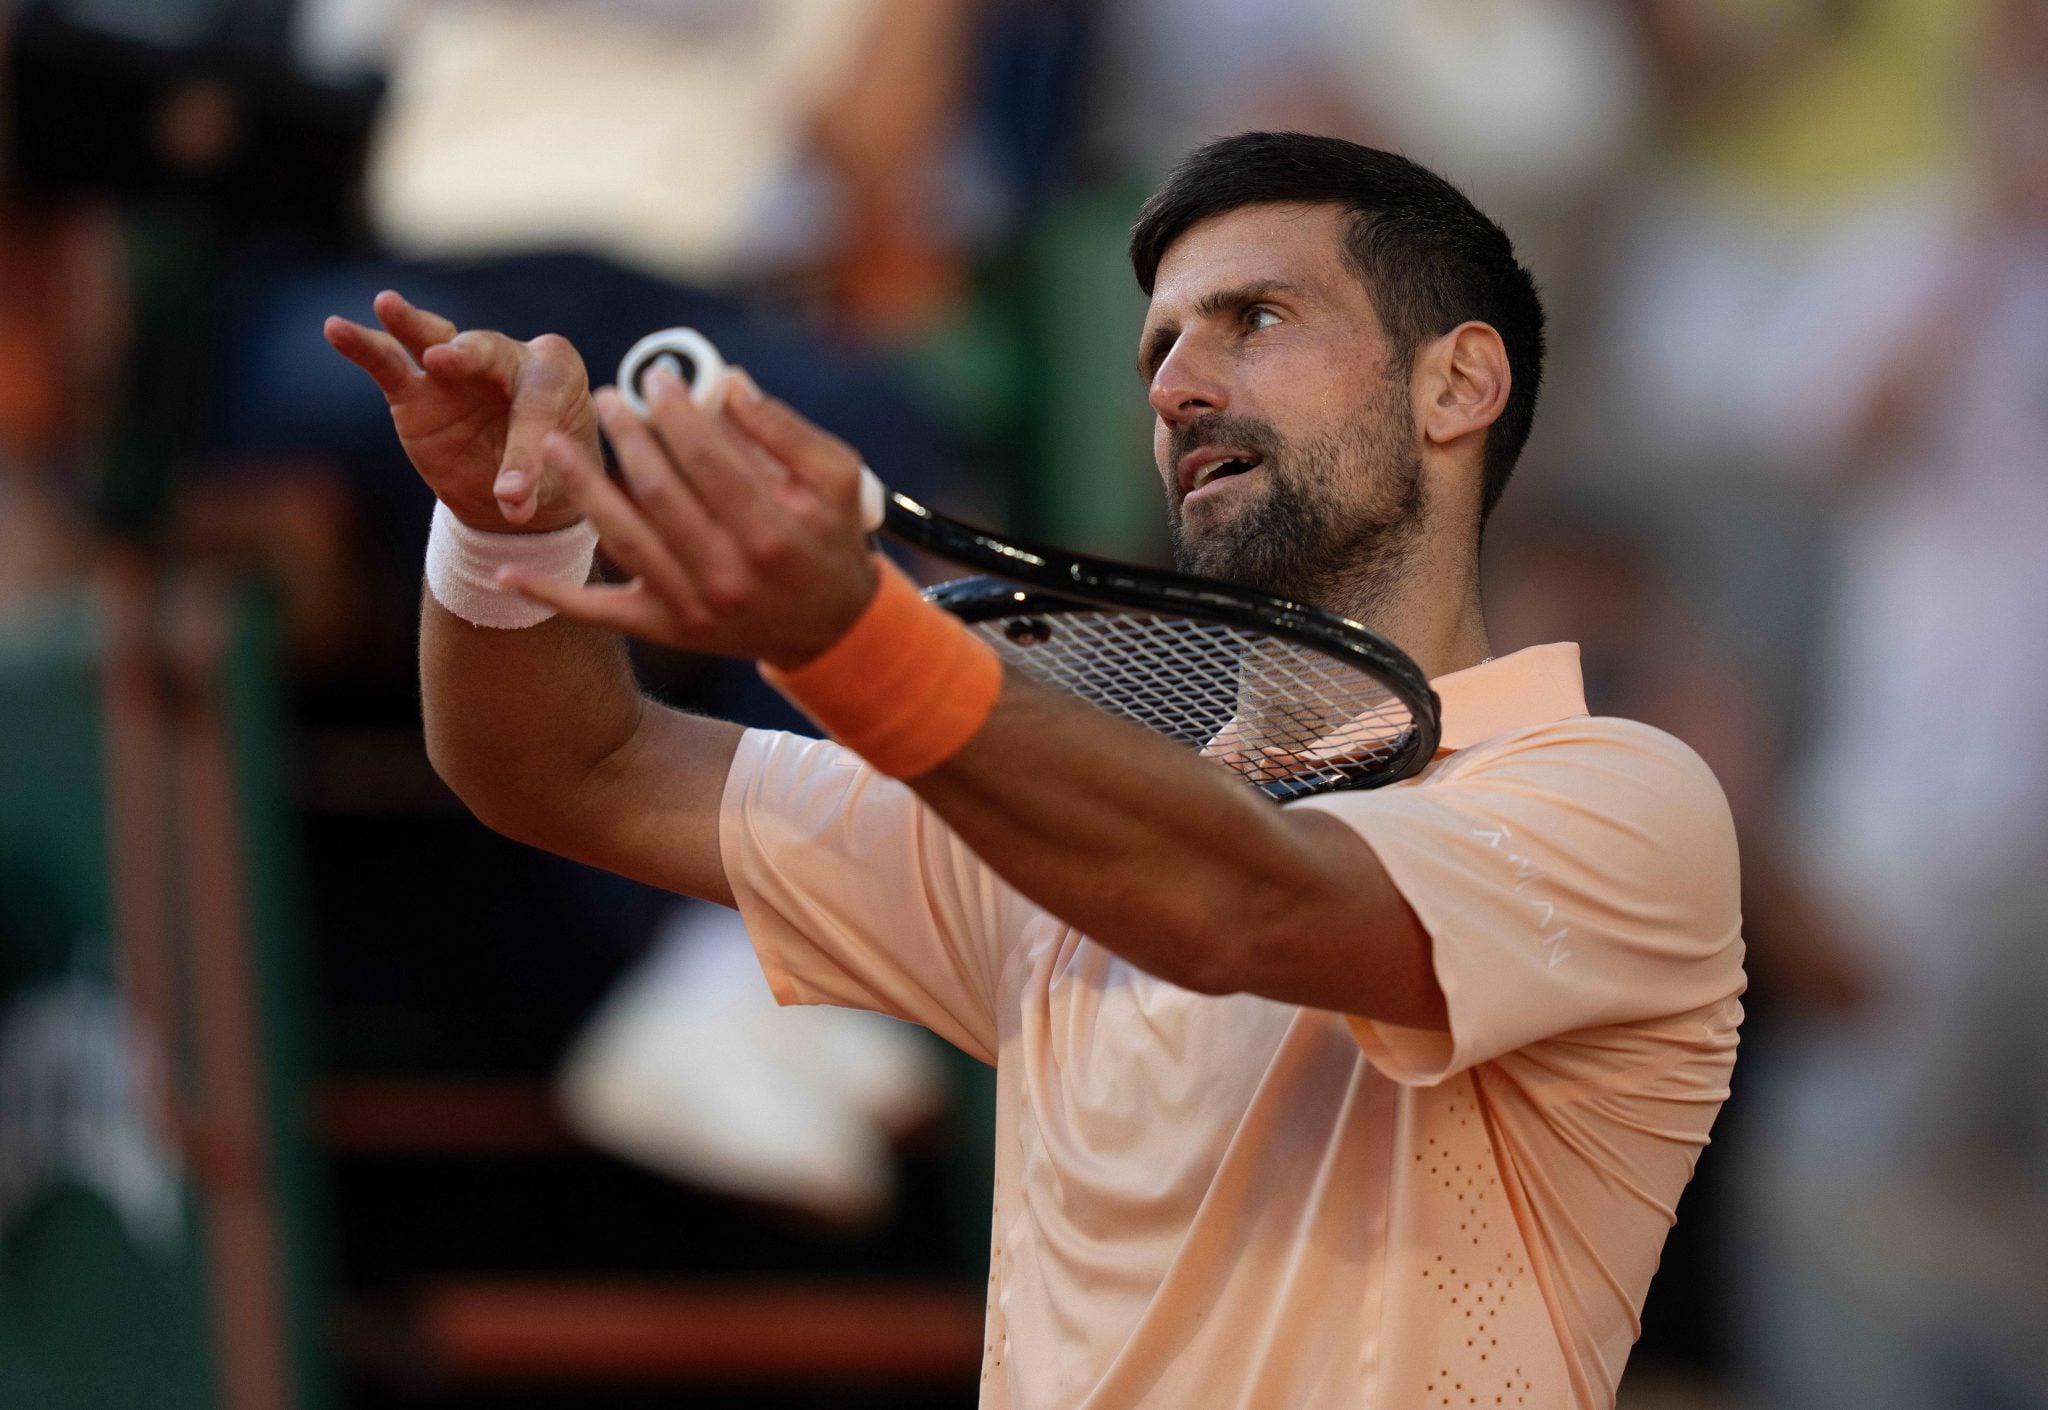
French Open third-round preview and predictions, featuring Novak Djokovic and Andrey Rublev
Third-round action at Roland Garros on Friday is headlined by a mouth-watering clash of generations that features Novak Djokovic and Joao Fonseca.
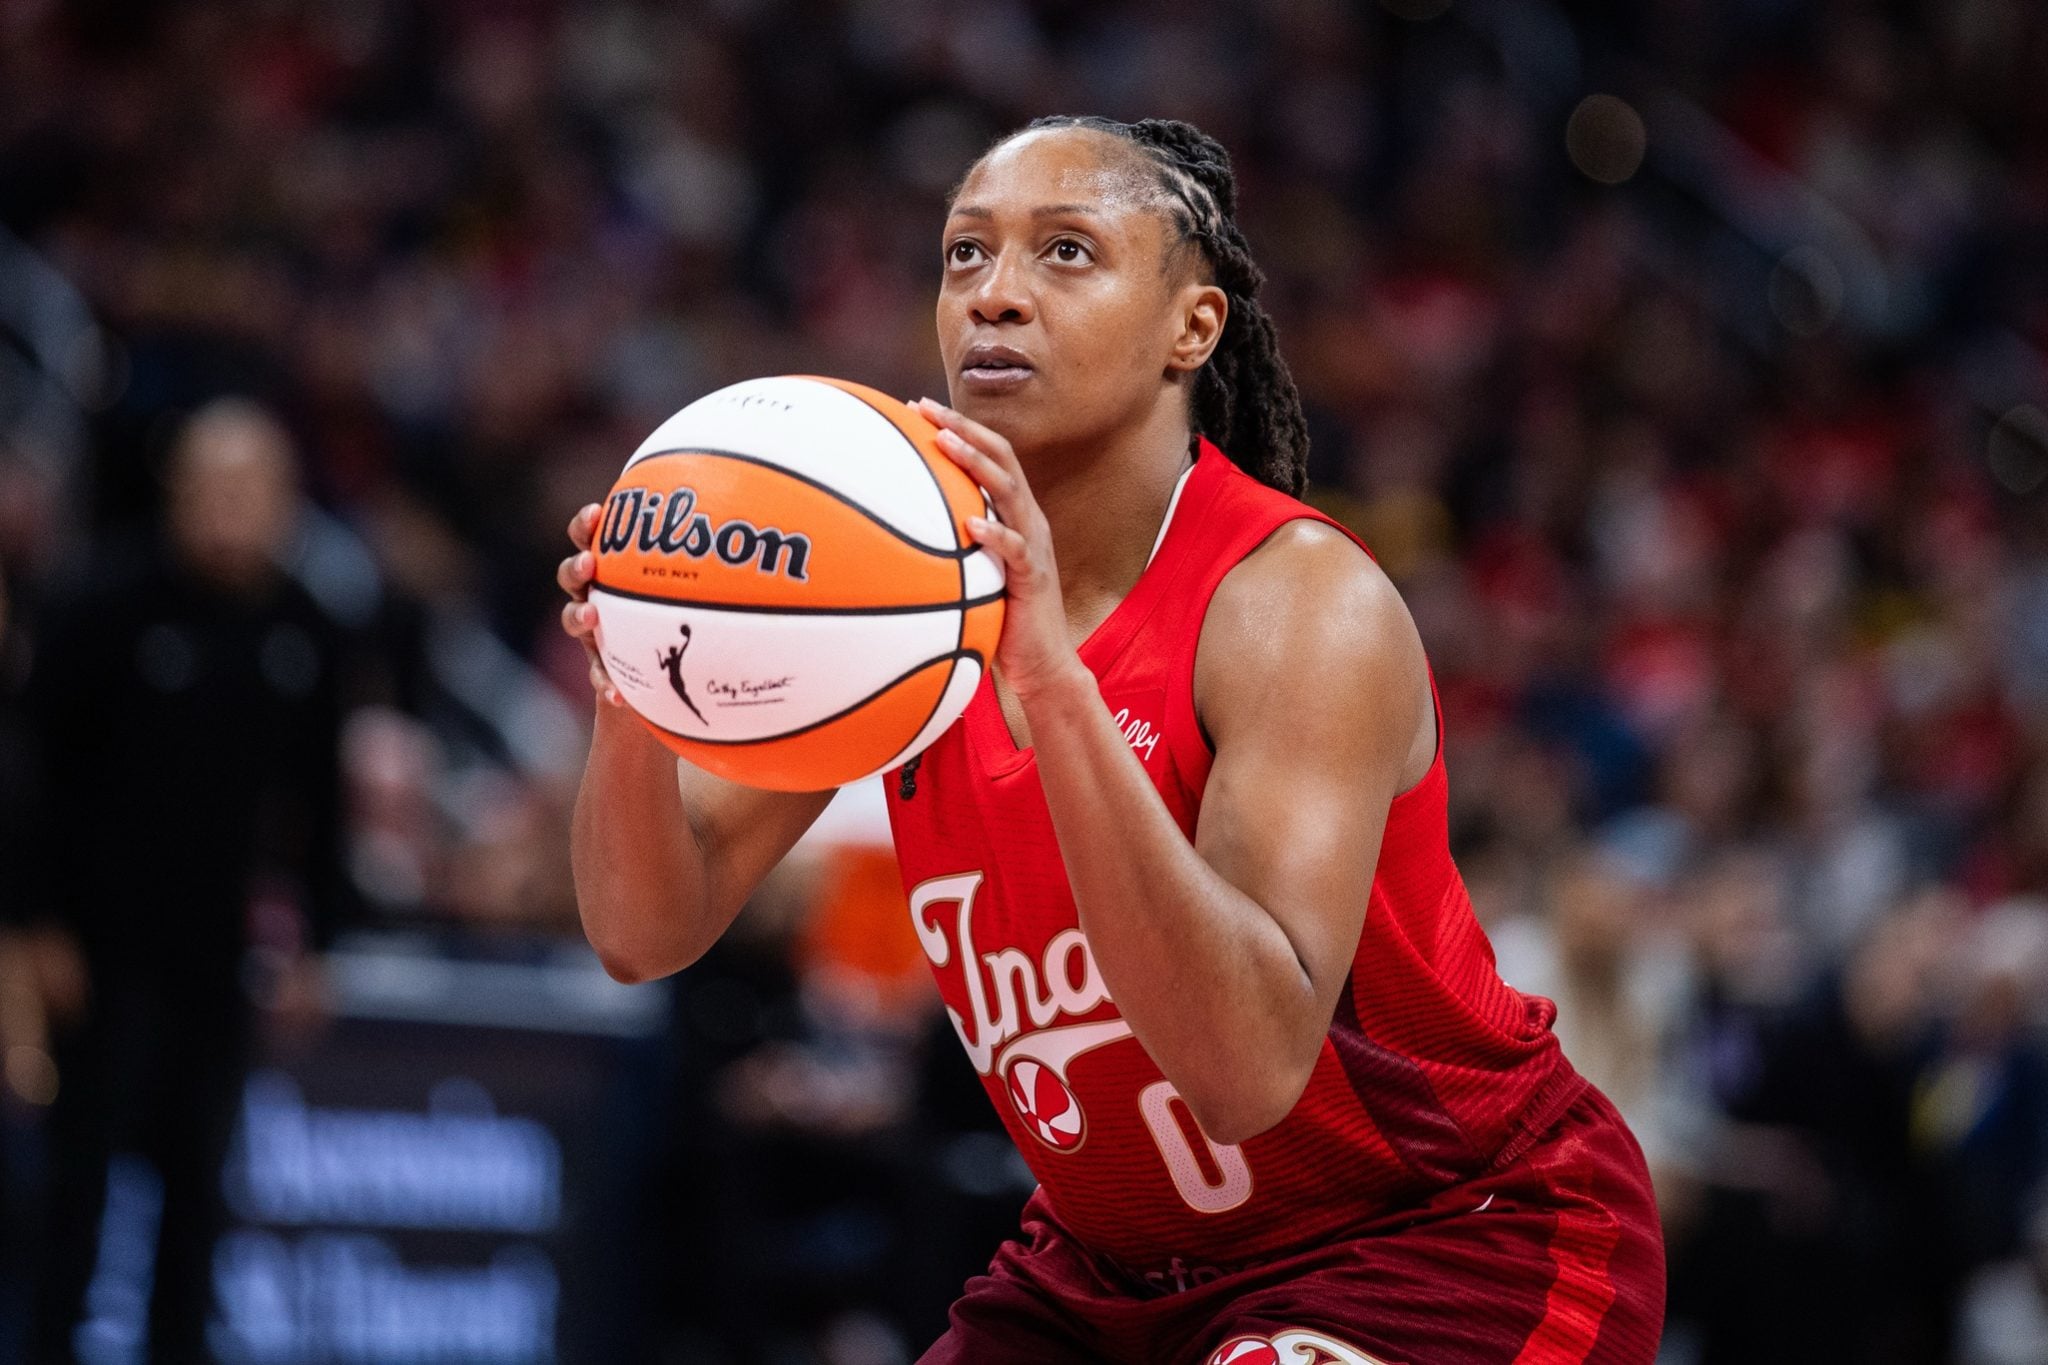
Indiana Fever vs. Golden State Valkyries WNBA preview and prediction
The Indiana Fever and Golden State Valkyries face off for the second time in less than a week, this time in San Francisco, Thursday at 10 p.m. ET.
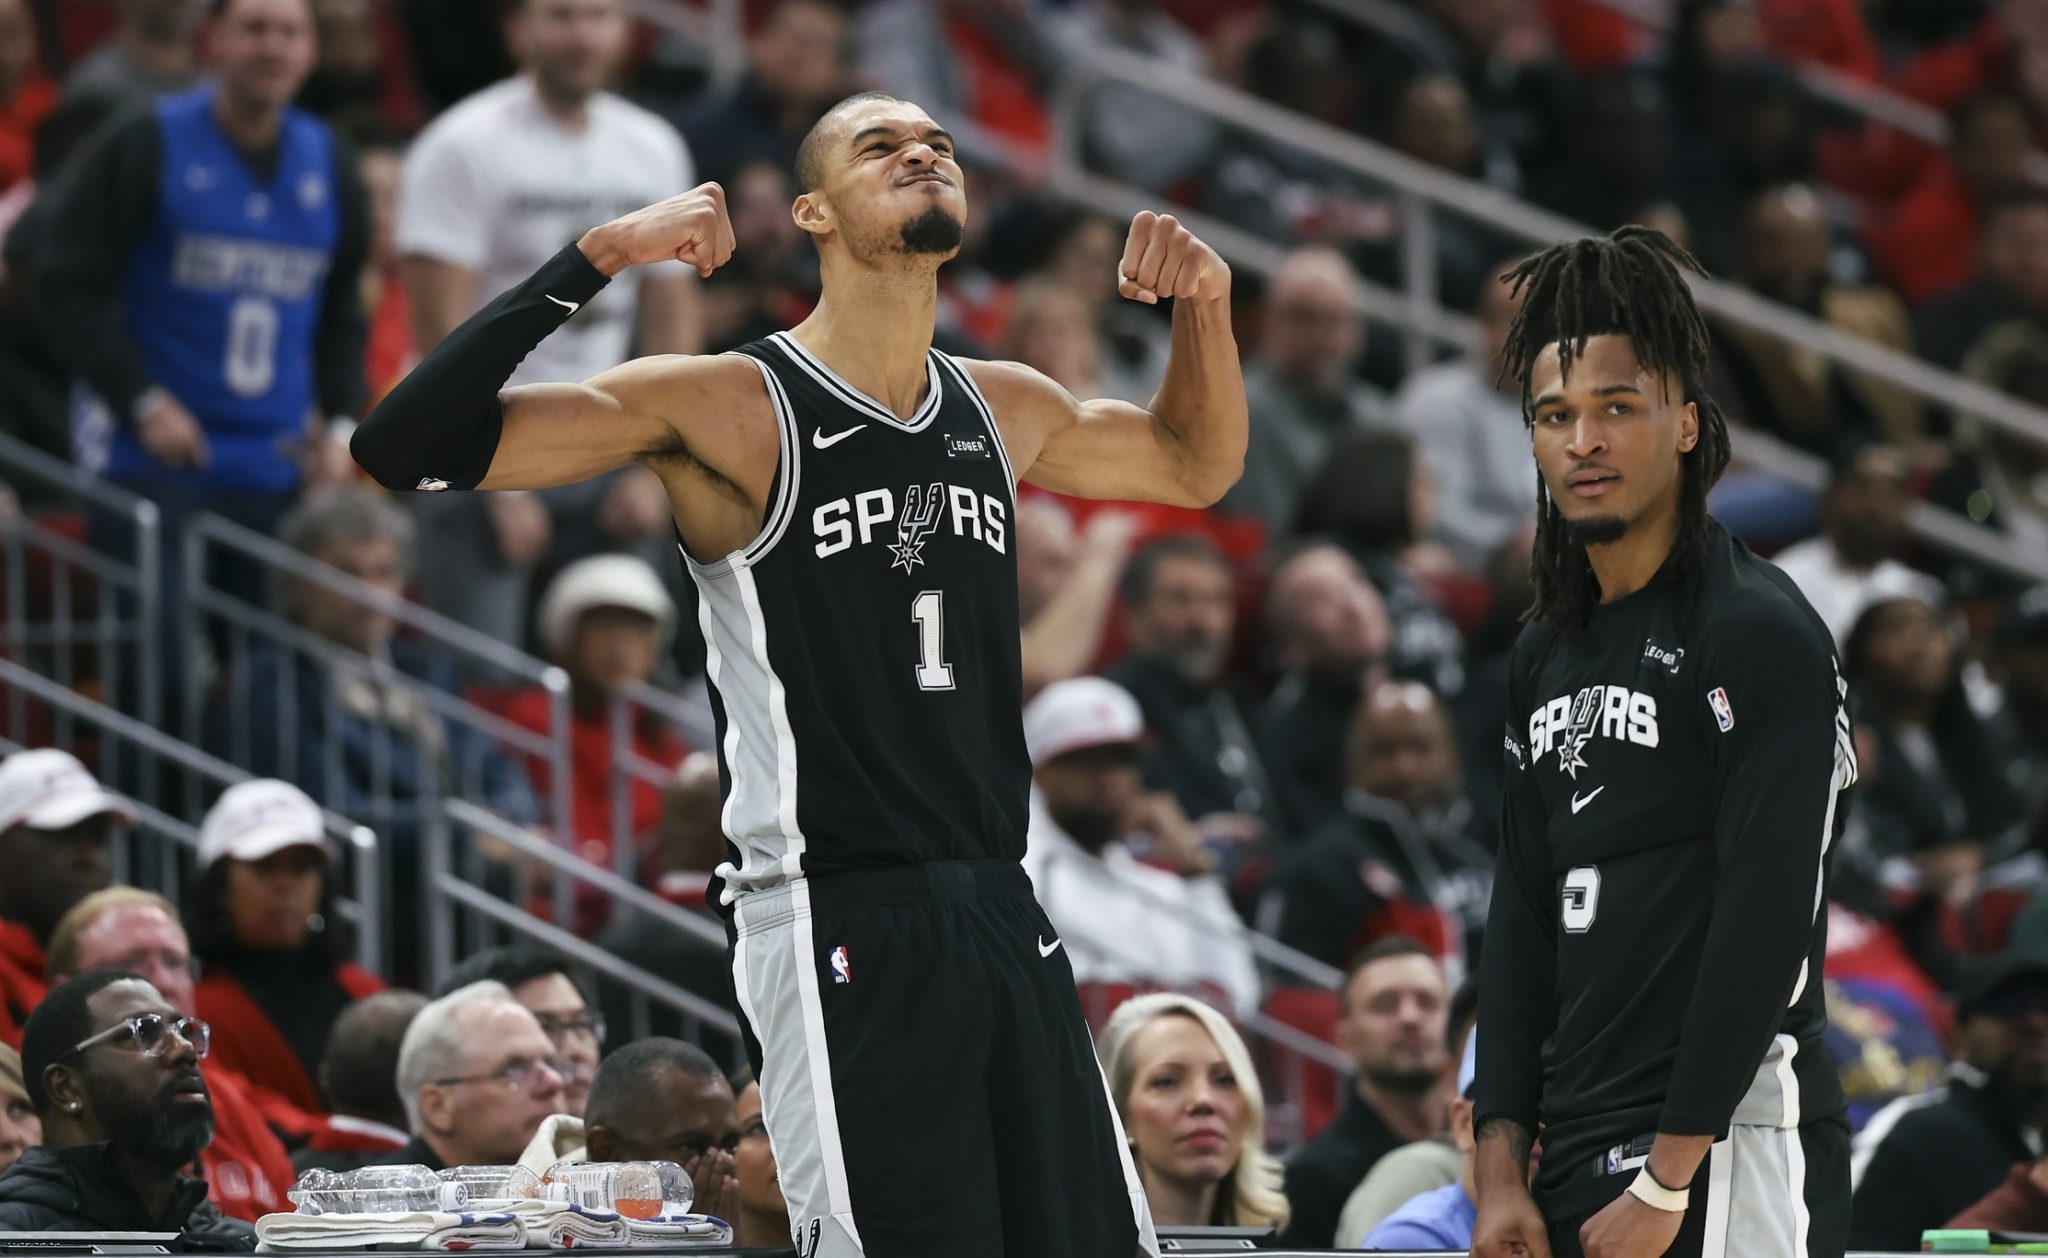
Oklahoma City Thunder vs. San Antonio Spurs Game 6 Prediction, NBA Odds
OKC has won three out of four, but the Spurs humiliated the Thunder the last time these teams met in San Antonio.
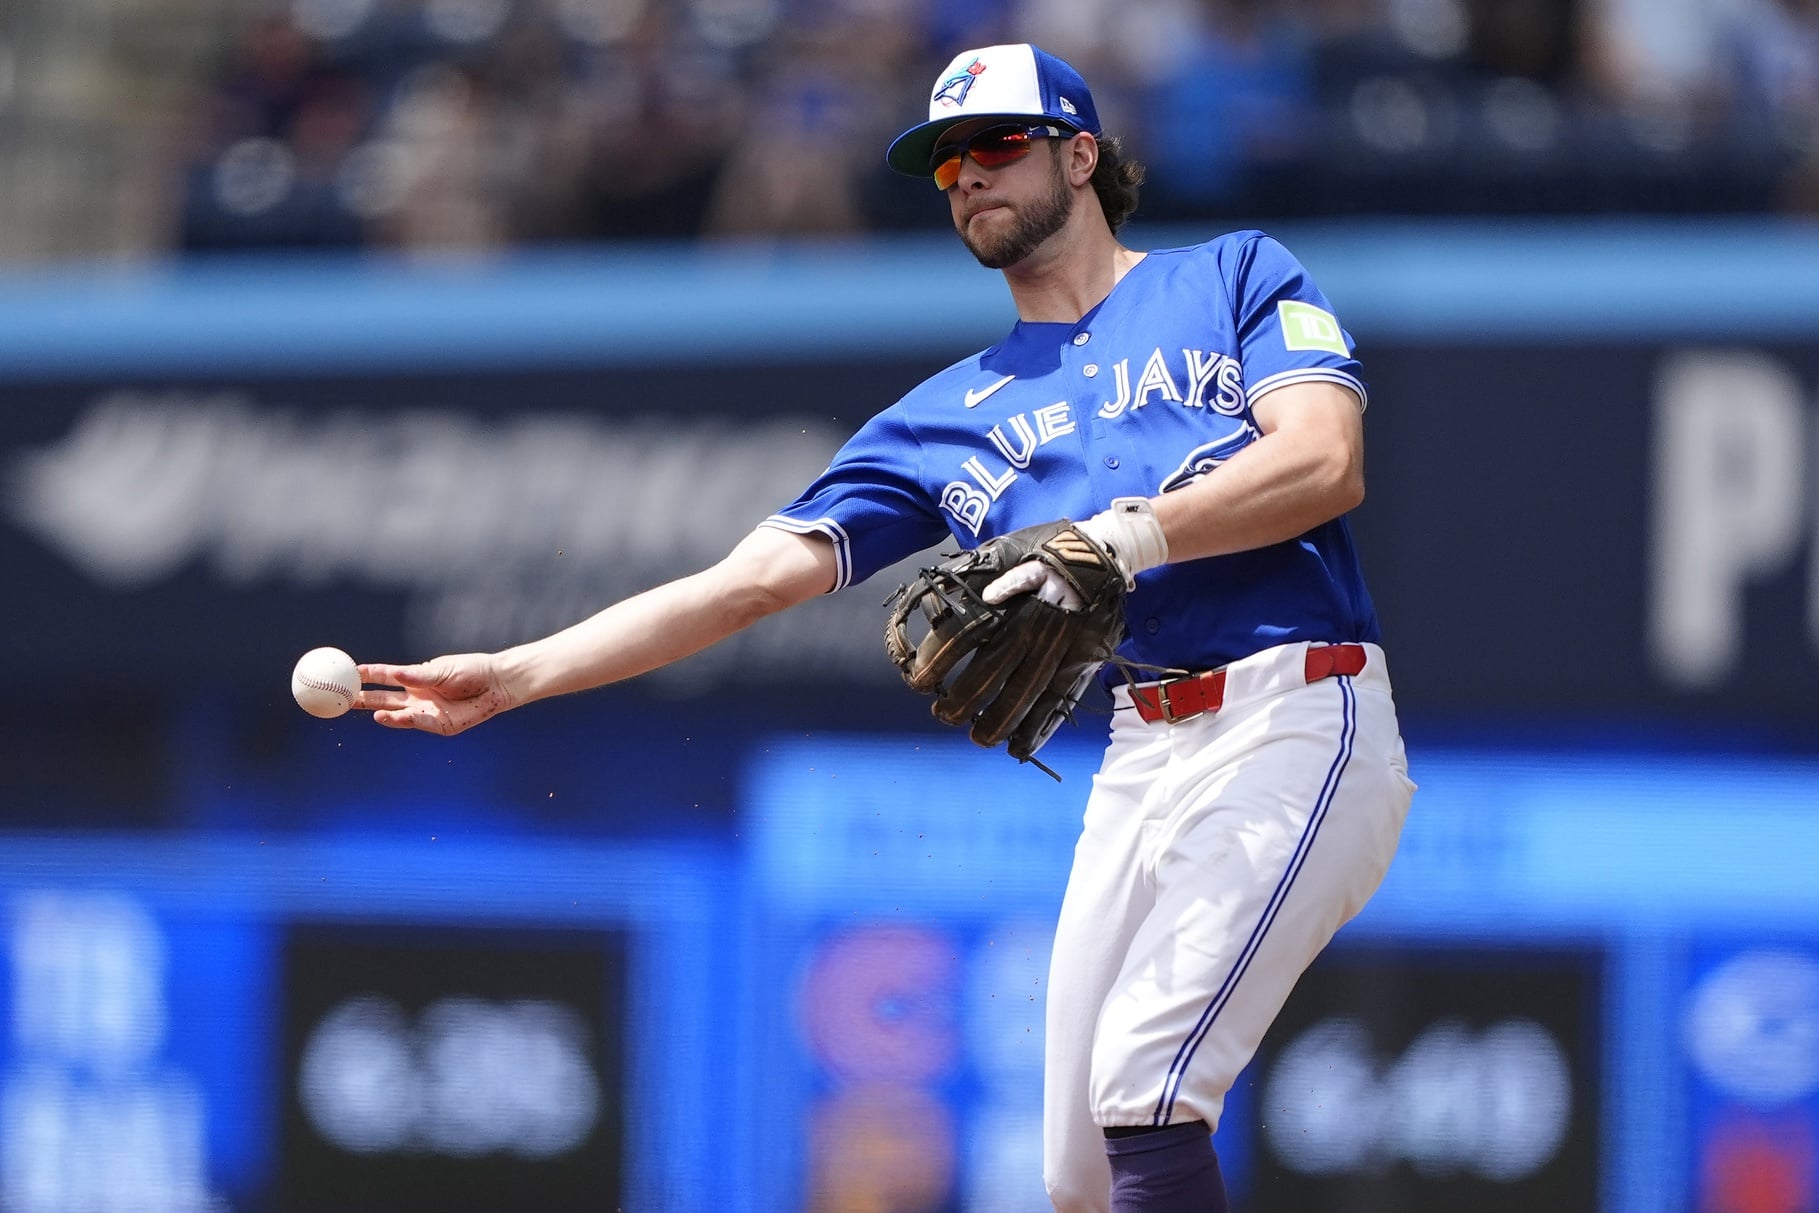
Toronto Blue Jays vs. Baltimore Orioles: Odds, Prediction
It’s back on the road for seven games starting Thursday night for the Toronto Blue Jays as they visit the AL East-rival Orioles for the first time this season to open a four-game set.
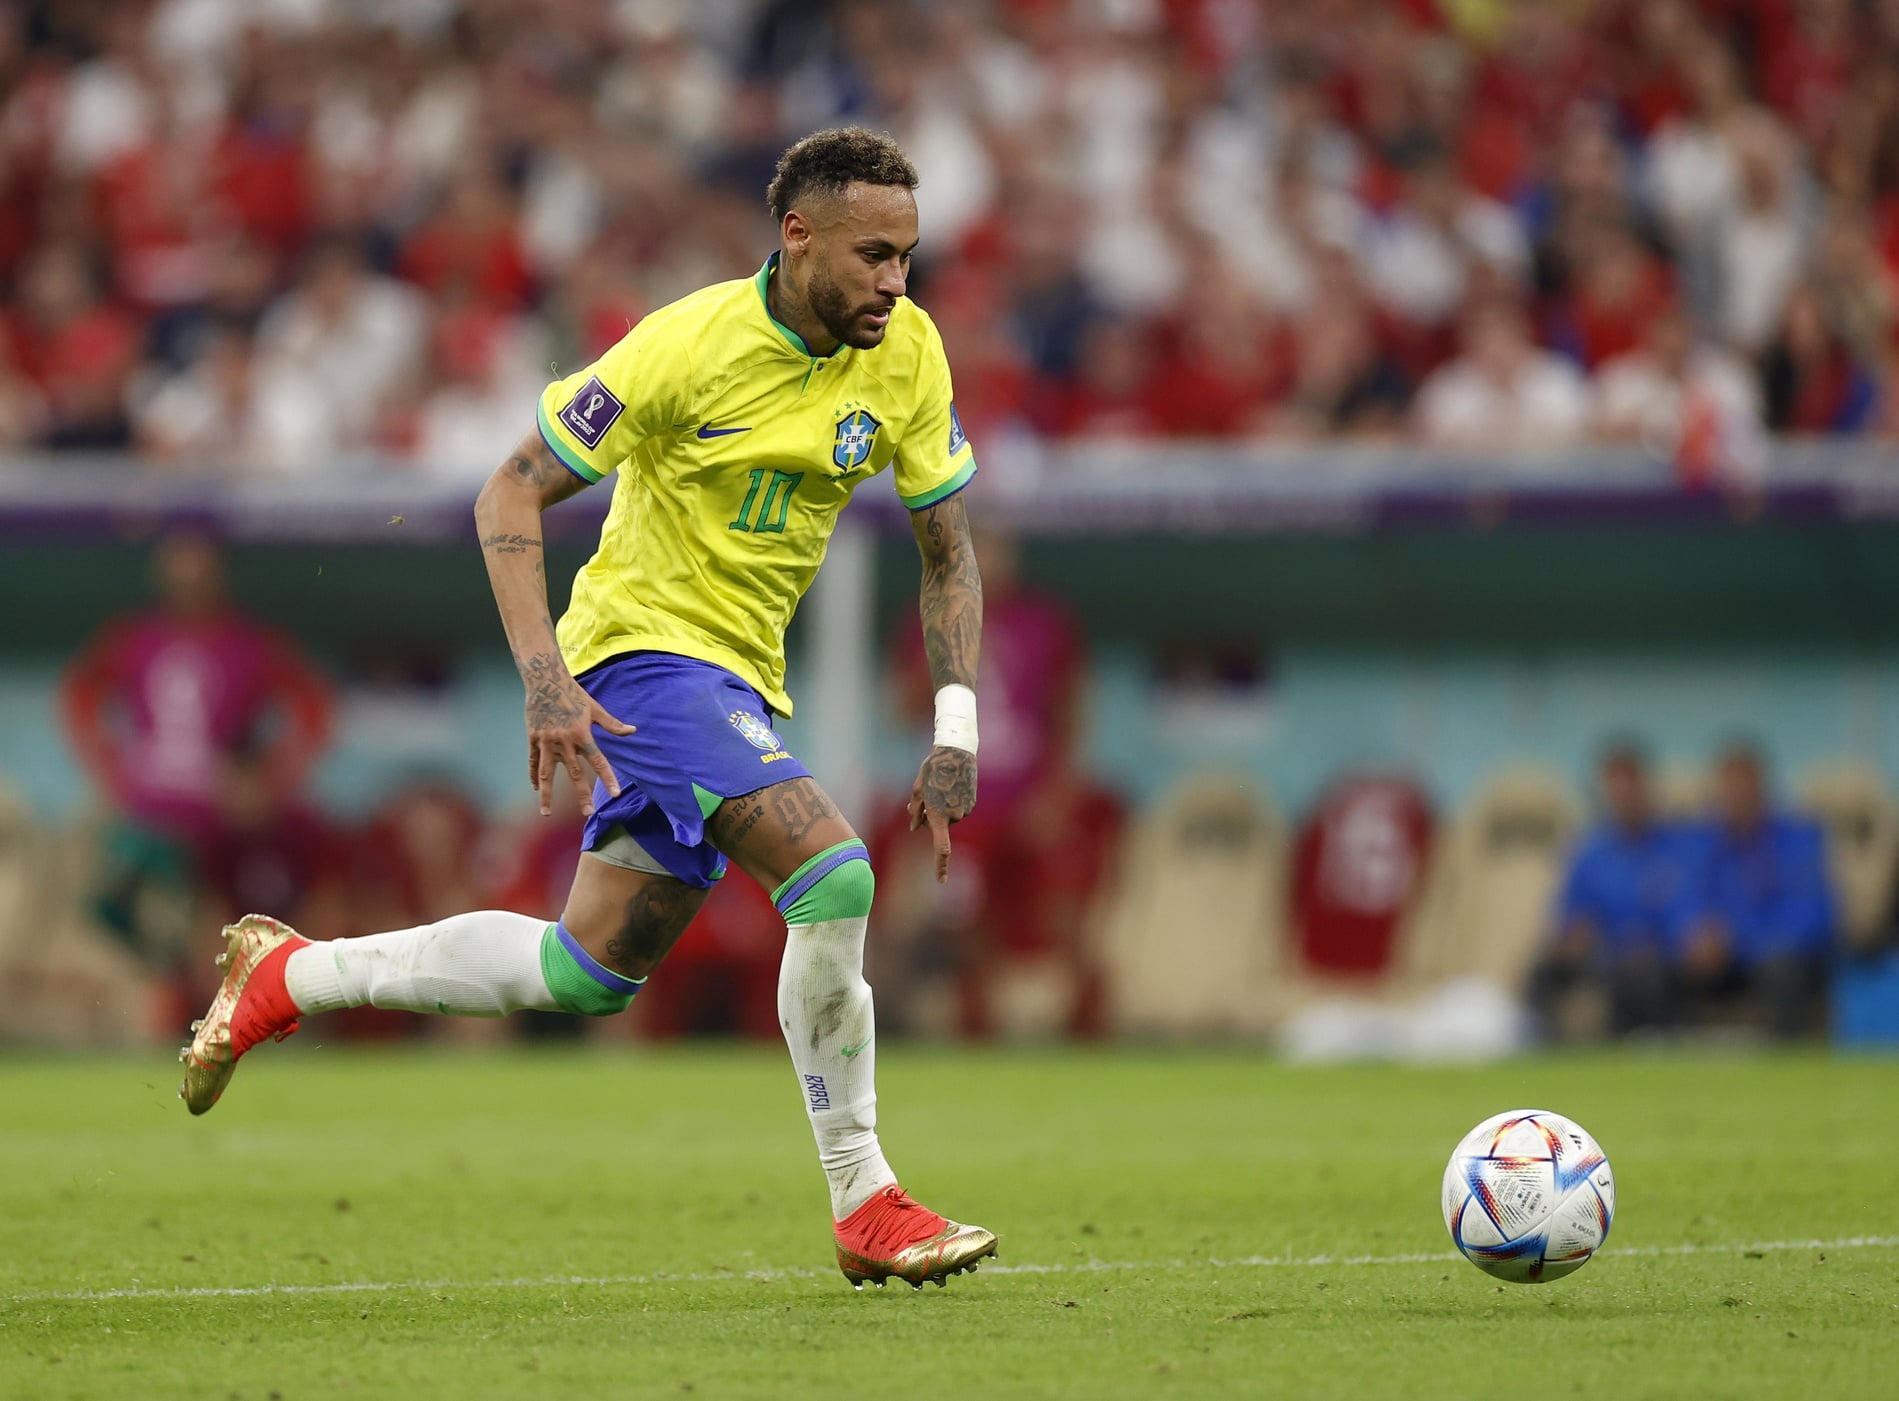
Report: Neymar injury puts his status in doubt for Brazil at World Cup
With Brazil opening the World Cup on June 13 against Morocco, Neymar is expected to be sidelined two to three weeks with a calf injury.
Philadelphia Phillies vs. Los Angeles Dodgers: Odds, Prediction
2026 IIHF Men’s World Championship Semifinal Odds, Prediction: Finland vs. Canada
Arsenal vs. PSG Champions League Final preview and prediction
Canada set to unveil FIFA World Cup roster Friday at 7 p.m. ET
Montreal Canadiens vs. Carolina Hurricanes Game 5 Prediction, NHL Odds
French Open third-round preview and predictions, featuring Novak Djokovic and Andrey Rublev
Indiana Fever vs. Golden State Valkyries WNBA preview and prediction
Oklahoma City Thunder vs. San Antonio Spurs Game 6 Prediction, NBA Odds
Toronto Blue Jays vs. Baltimore Orioles: Odds, Prediction
Report: Neymar injury puts his status in doubt for Brazil at World Cup


